A collection of data visualisations
Post-digital Collection:
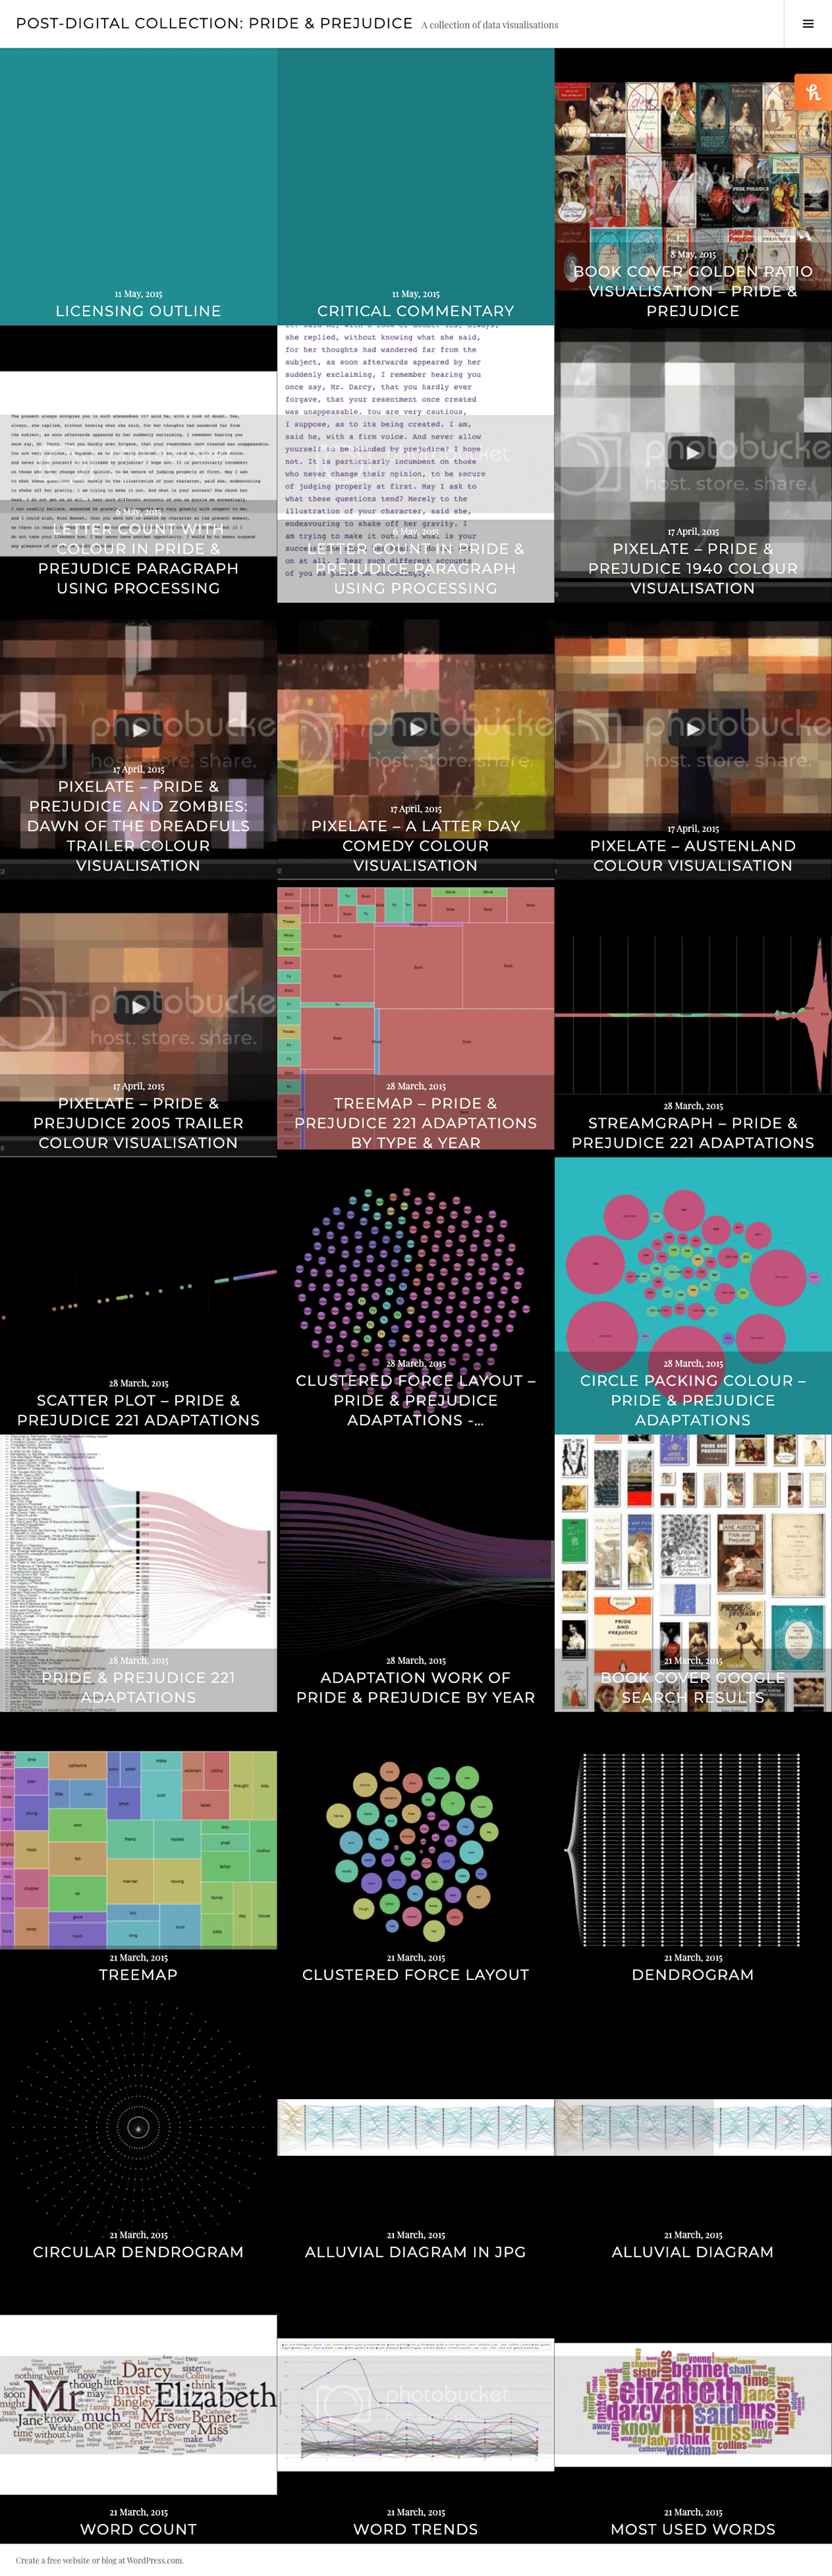
Pride & Prejudice Data Visualisations
New Developments in Digital Media
Critical Commentary
To theoretically contextualize the project, I would like to reference topics related to knowledge production, knowledge mapping, and knowledge and information dissemination. The project directly engages with seeing data visualizations as the new way of knowledge mapping that uses automated software to create different ways of looking at information.
Before being able to use data visualisation tools, and more importantly, is to choose which type of data you are going to use and whether it already exists, if you can access it or if you need to create or curate raw data. For my project, I decided to take the content of books as my raw data, to which I selected Pride & Prejudice by Jane Austen as my starting point of experimentation due to the vast quantity of material I could access and which I could turn into data to experiment with.
The reason behind choosing a book and turning its content into data arise from Franco Moretti’s Operationalizing article, which addresses how knowledge is changing due to computational tools that allow us to gather data and go from close-reading into distant reading, letting computers rather than humans handle information due to their unlimited capacity, revealing in the process new ways to make interpretations of book narrative, culture, literary theory, etc.
As in operationalizing, my project is “taking a concept, and transforming it into a series of operations” (Morietti, 2013), adding detail into what we know about Pride & Prejudice but also changing the way we look at the existing knowledge of how many words are in the book, how many adapted work exist about it, etc.
First of all, I did some experimentation with word count to visualize the most used words in Pride & Prejudice because “they capture different features of dramatic networks, and of the conflict that is latent at their centre” (Morietti, 2013).
Likewise, I decided to expand the project into the existence of adapted work through the years as a representation of knowledge production of the book, taking into account any kind of media platform that had either make use of the name or reference to the novel, the characters or story. The second part of the project is thus based on visualisations of 221 different adaptations found in existence.
Experimenting with new ways to visualise data, I decided to create a colour visualisation with 5 trailers of Pride & Prejudice movie adaptations, which I pixelated to show the palette of colour used either by the specific director of the adapted work or the colour repetition showed in the overall work related to the novel.
Moreover, I went back to specific and focus on letter count in a specific paragraph of the novel adjusting to the software tools I got access to and the specifications this tools already included. Finally, due to the amount of different book covers in existence of the novel, I decided to create a visualisation not only to appreciate the change through time but also to appreciate how they all respect a golden ratio proportion, how they show a preference for specific typography or specific elements.
In conclusion, the project can be seen as a collection of post-digital artefacts with Pride & Prejudice as motif, the project allows to create and share new ways of mapping knowledge by letting users look at the visualisations but also giving access to the raw data to interpret in new and different ways. “It shows that, by following a series of steps, you can turn abstractions into a clear and, hopefully, unexpected elaboration of reality” (Morietti, 2013).
Sources
Berry, D. (2015). New Developments in Digital Media Seminar. [class notes] Sussex University.
Moretti, F. (2013). Operationalizing. New Left Review. Available at: http://ift.tt/1eKyO3d