
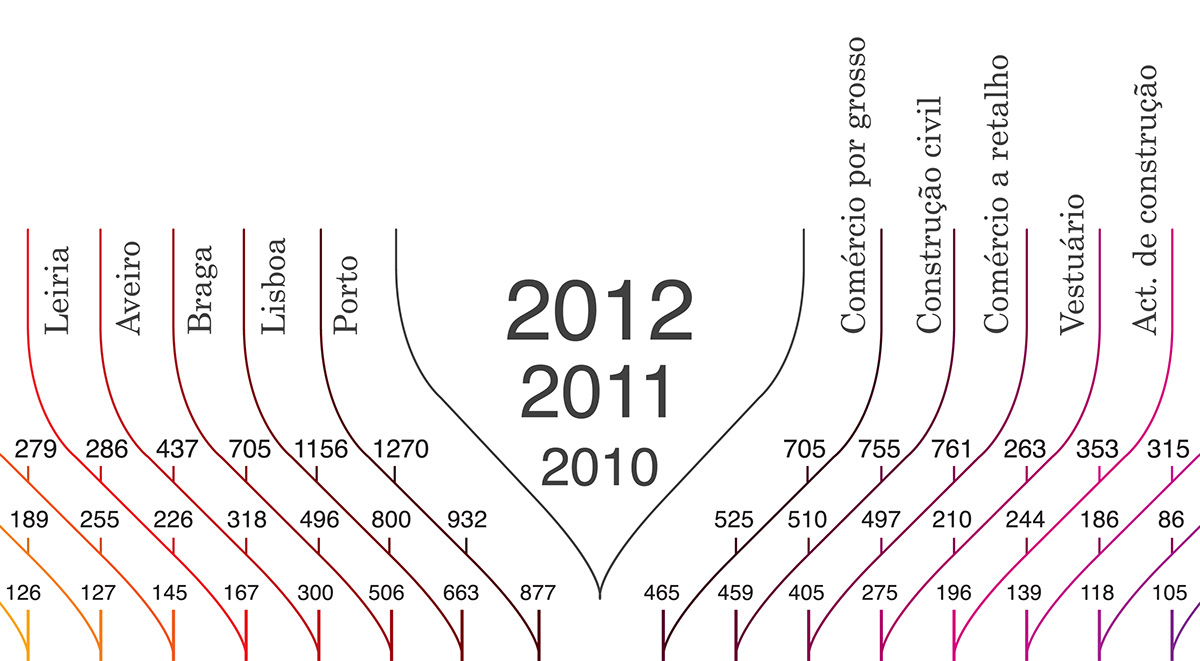
Distinguindo entre os distritos e os vinte sectores de actividade que mais têm sofrido com a crise entre os anos 2010 a 2012, esta infografia foi desenvolvida graficamente com base numa estrutura representativa de uma empresa. Assim, é facilitada a distinção entre valores ao longo dos anos, utilizando planos tridimensionais. Ao utilizar o círculo de cores completo pretendo dar ênfase a como se complementam os dois gráficos apresentados.
//
Distinguishing between the districts and the twenty sectors which have suffered the most from the Portugal crisis between the years 2010 to 2012, this infographic was developed based on a structure representing a company. Thus, it is easy to distinguish between values over the years using three-dimensionality. By using the color wheel complete, my intend was to emphasize how complementary the two graphs are.


Para mais informações acerca da insolvência de empresas:
// For further information on company insolvency:
www.iic.pt

