Task
At design course we had a task to remake a table. Table represents data about pollution in the factory. Pollution is divided by departments.
Here is the original:

My variant
In my version:
1. All bold lines are removed
2. Year label is moved into title
3. Added comparisons of all substances
4. Added infographic about highest possible level (without danger for health)
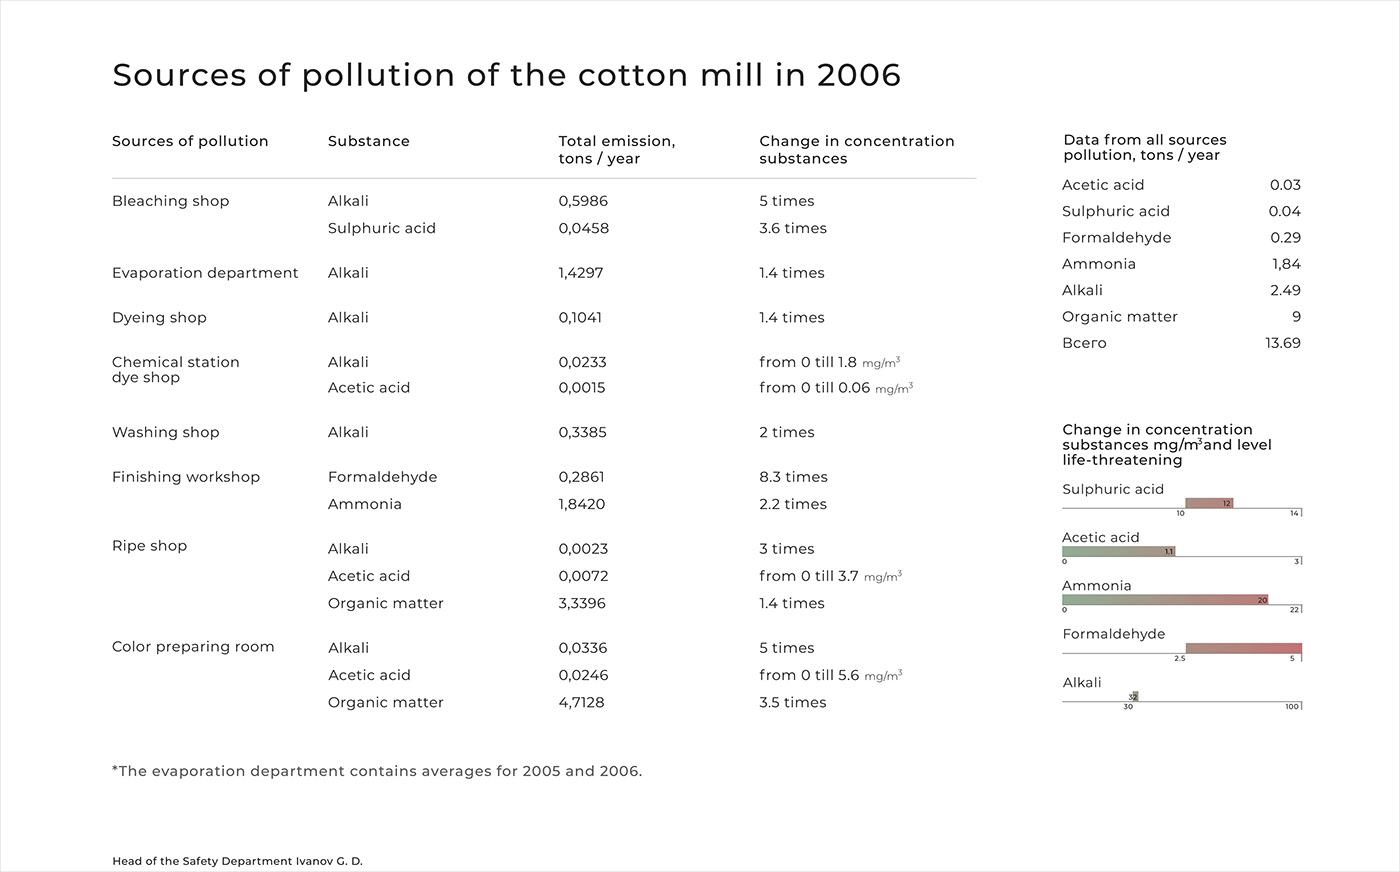
English version
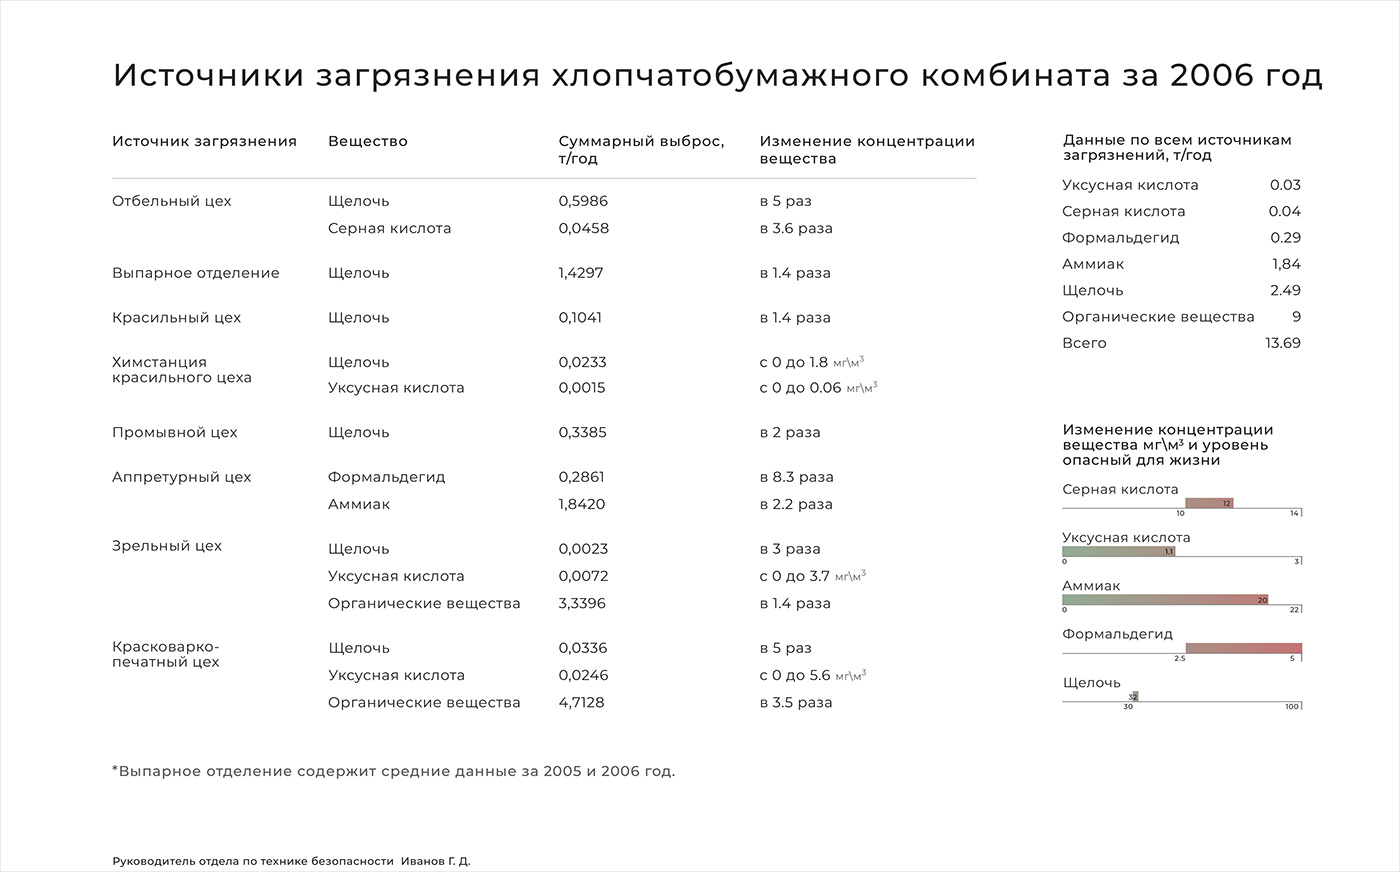
Russian version
