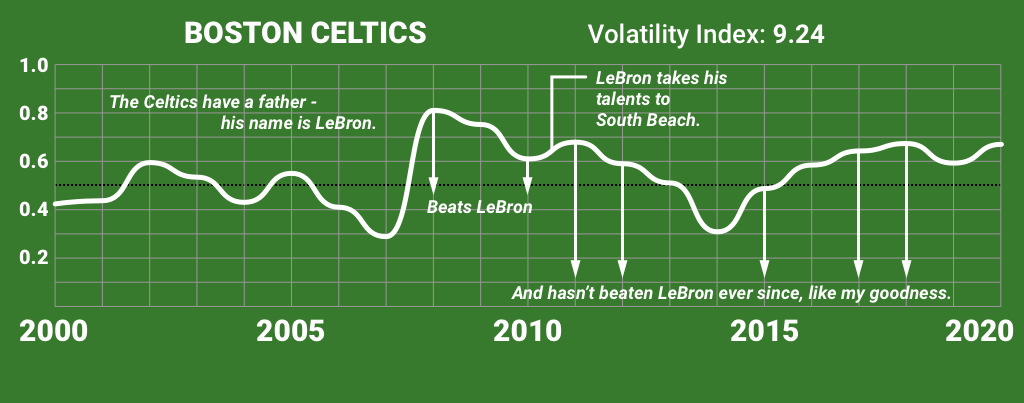
There was a Youtube video that came out from Secret Base called, "The history of every NFL team | Chart Party" that inspired me to make these graphics. These not-so-interesting, interesting charts show the winning percentage of every NBA team beginning in the 2000's ranked by volatility index.
Volatility index - the difference in wins from year-to-year.
As a sports and analytics nerd, I hope those that like these things enjoy this content. I had a ton of fun doing this. I hope yinz enjoy! And go Celtics.