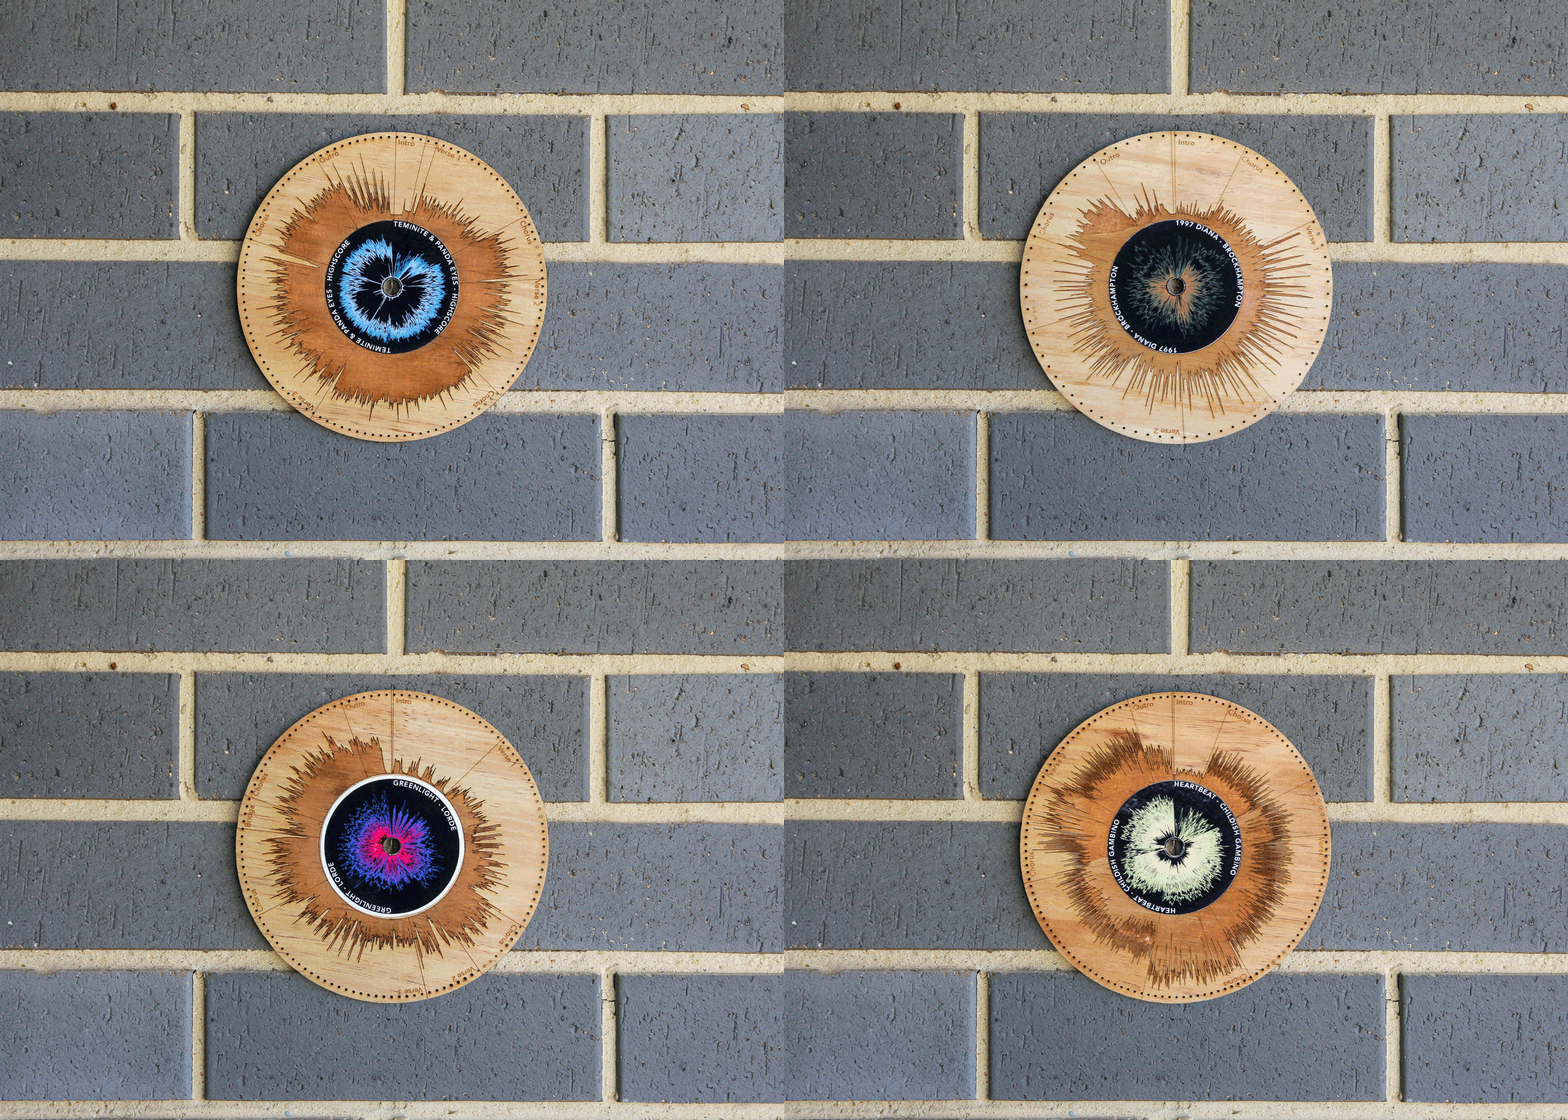
Providing opportunities to visualise data that isn’t usually seen is an effective way to capture the attention of the viewer. Music data is an excellent example of this.
Separate codes worked simultaneously to detect and draw the amplitude and frequency of the music around the circumference of a 5” record, as well as identifying the BPM and laser cutting it into a piece of plywood that was set around the edge of the vinyl. Subsequently, a code detects the different sections of the song (chorus, verse, bridge) and cuts them into the plywood at the appropriate intervals.


