The Climate Change in Figures
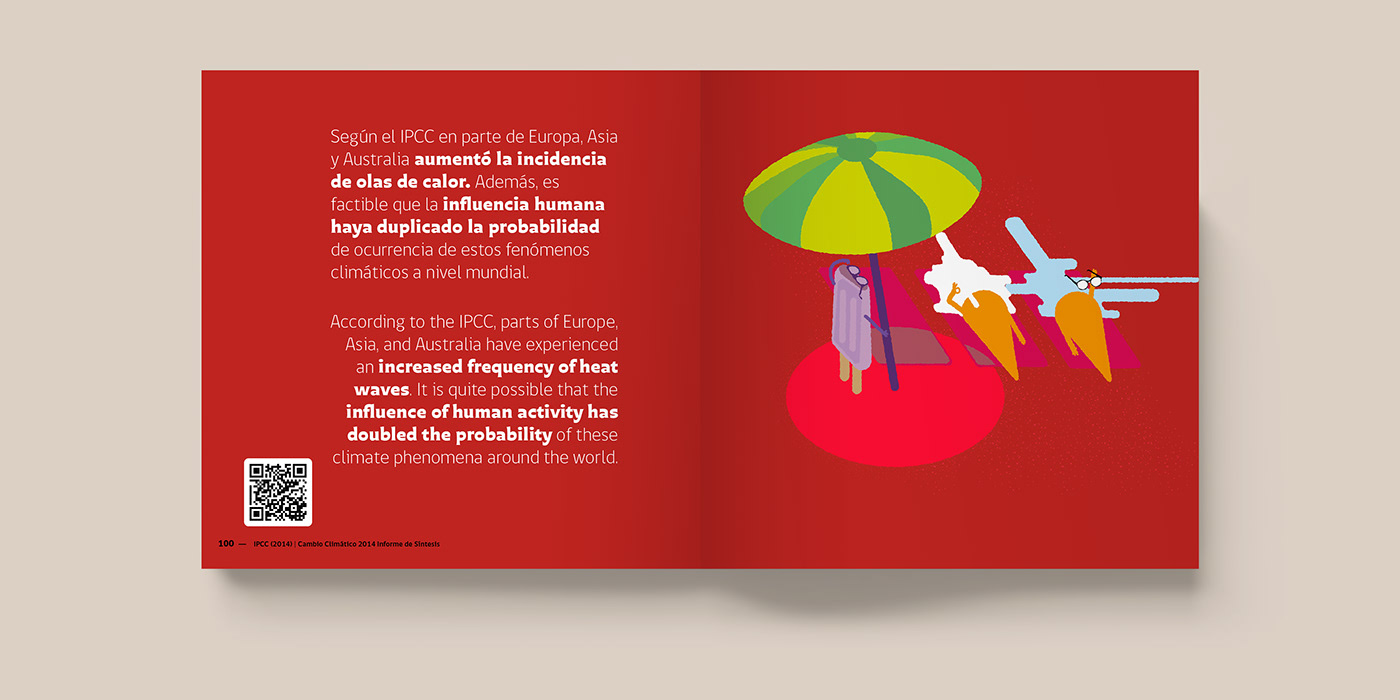
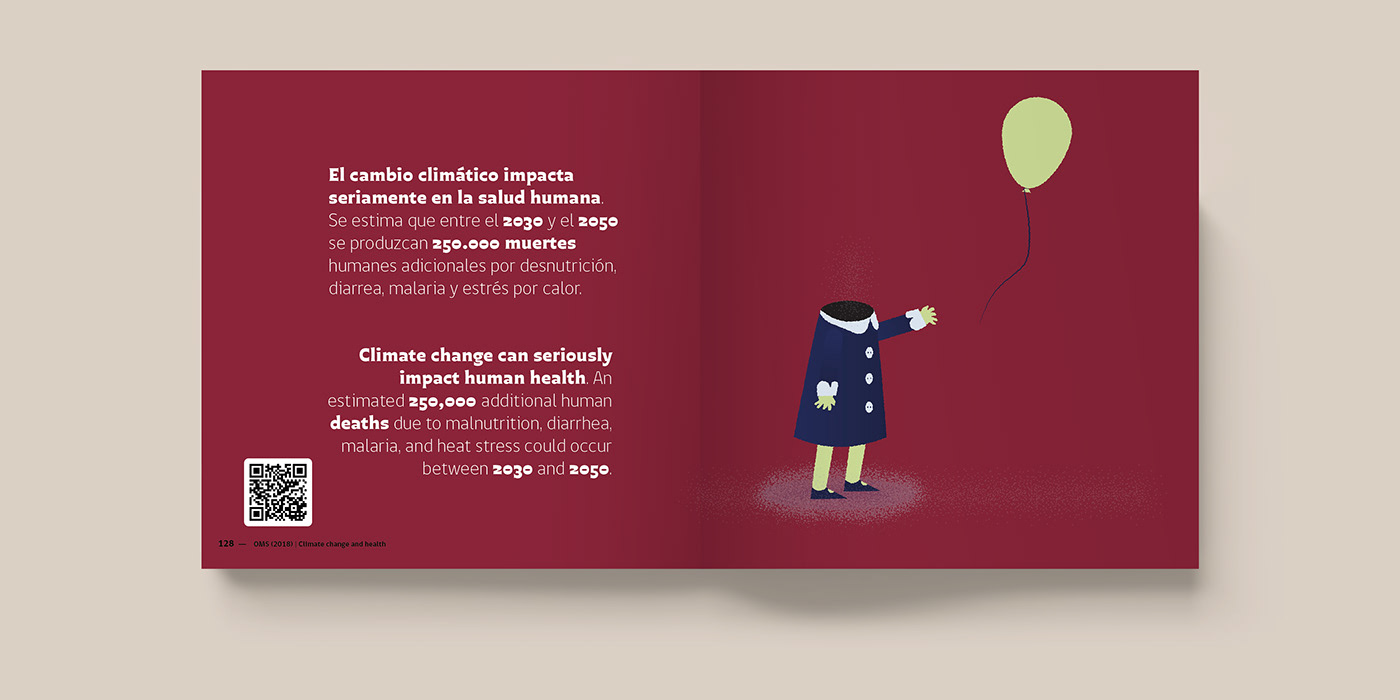
The contents of this book are organized in causes, effects, and mitigation of climate change. Each page is coded by a different color, so that the graphics gradually change from blue (cooler) gradients, to orange and red (referring to warmer temperatures), approaching the world's current situation. Then, from the "global emergency" (effects pages), the colors move towards blue again, representing mitigation and adaptation actions.
Free download here


Enjoy and Share


