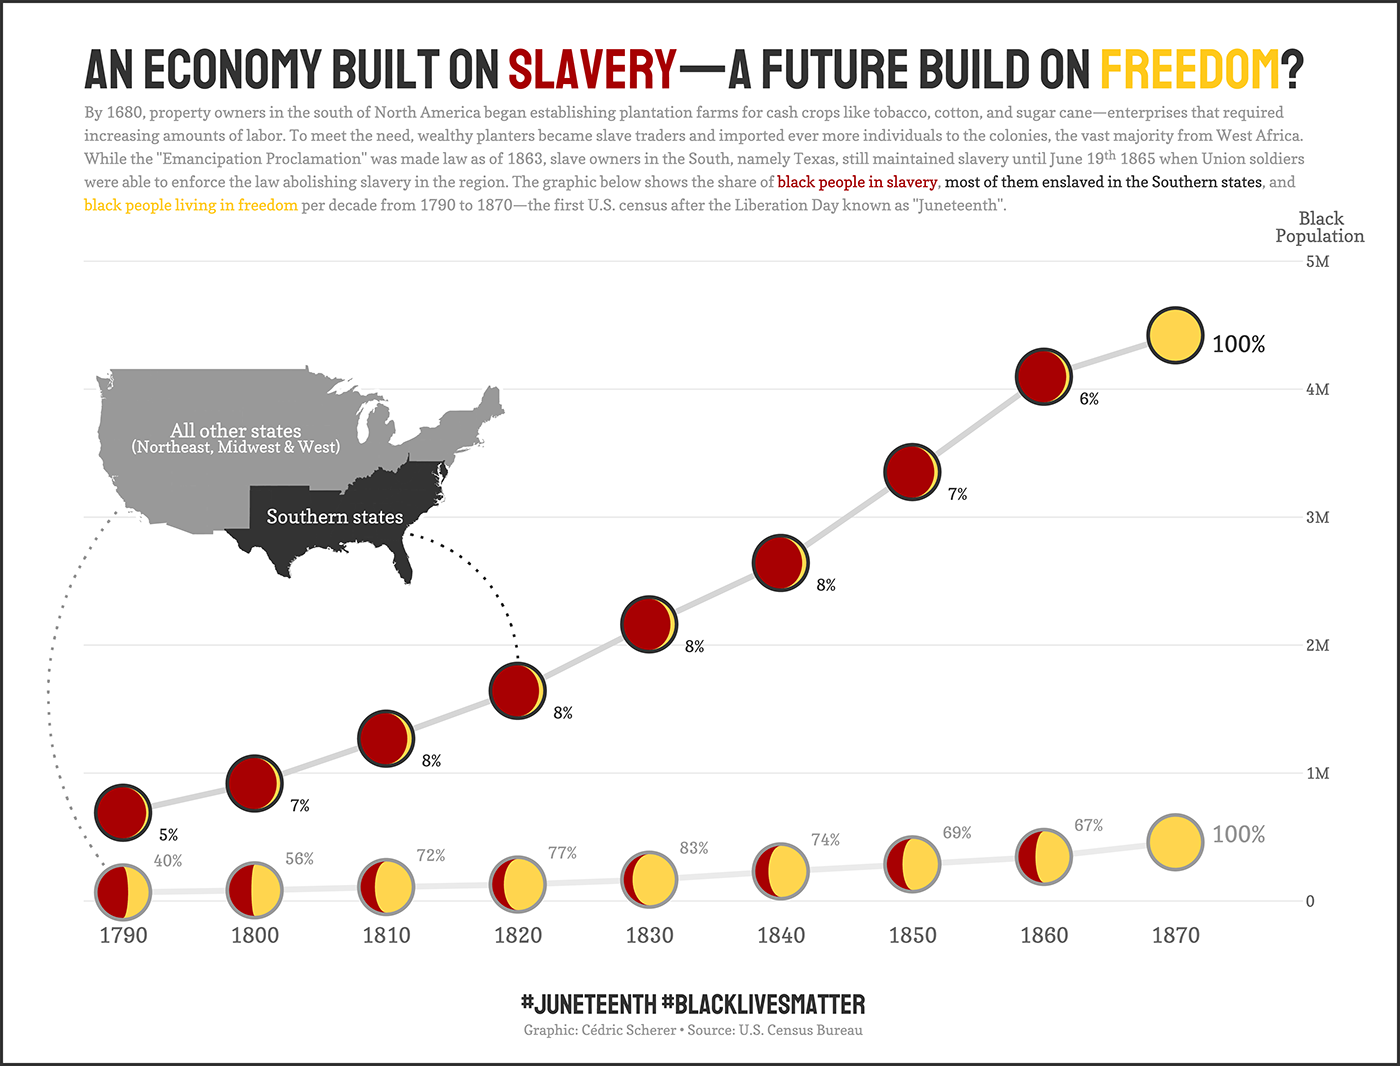
An Economy Built on Slavery
The combined line plot and moon charts show the number of black people and the ratio of those being in slavery versus those being free for Southern states in America and all others according to the U.S. census data from 1890 to 1870.
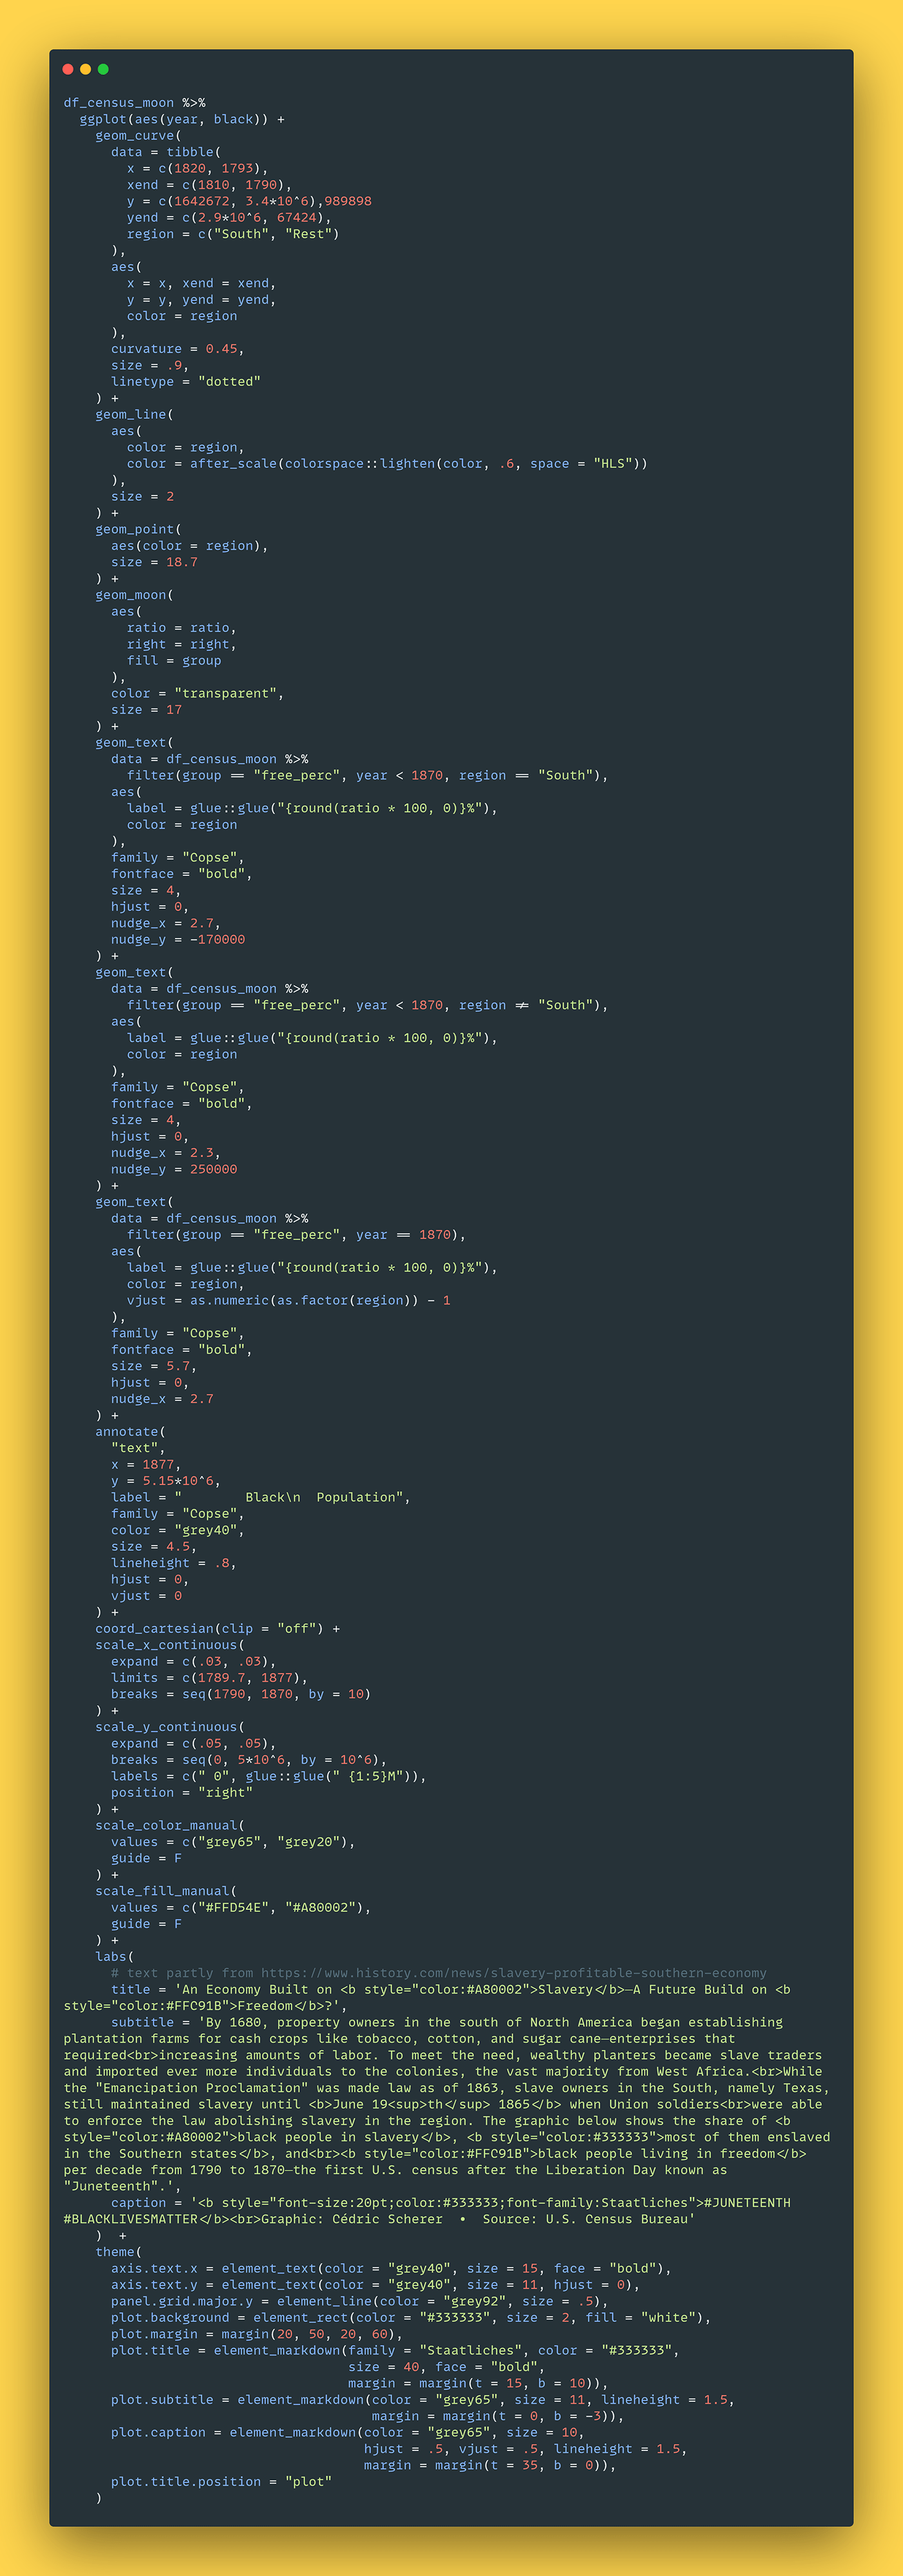
Tool: ggplot2 in R
Data: U.S. Census Data
Data: U.S. Census Data
Project: Challenge contribution to #TidyTuesday
Details


Code
Thank you for your visit and happy Juneteenth!
#BlackLivesMatter


