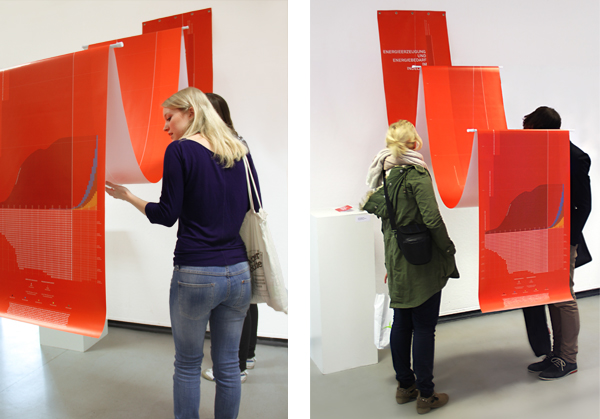
ENERGY INFOGRAPHICS
Project for an exhibition of the "Entwicklungsgesellschaft Indeland mbH".
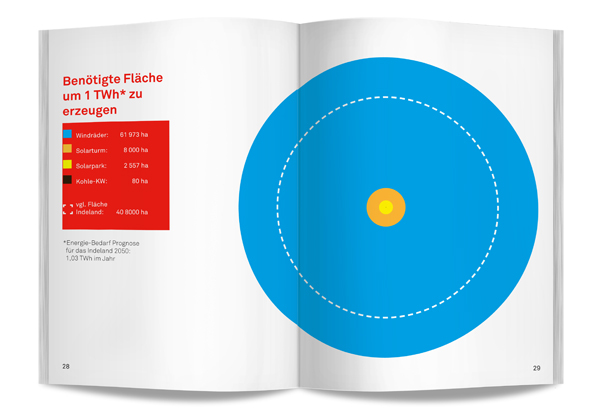
A series of infographics about energy generation in a specific region of Germany called "Indeland".
The graphics were made to create awareness about the situation and the dimensions of several energy sources and to allow an opinion to form about future perspectives and possibilities.
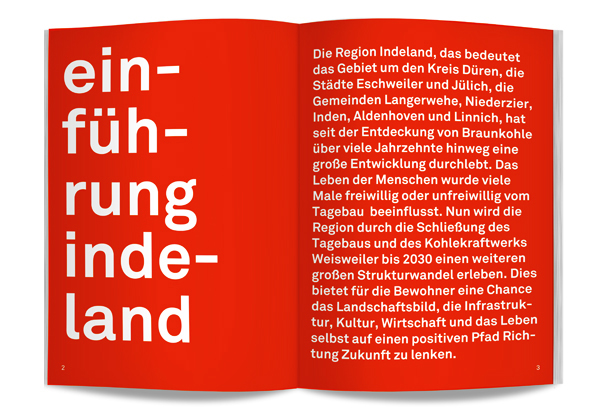
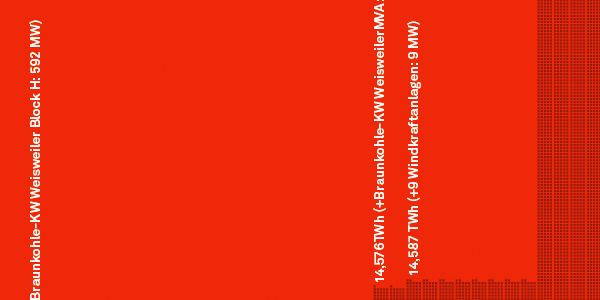
"Indeland" is an association of various cities and villages, located in a region in central-west Germany with one of the biggest lignite surface mines in the world. With the mined lignite the region provides energy for itself and a large part of Germany, while alternative energies from the same region are not even sufficient to provide energy for a fraction of the people living there.
In 2030 the surface mine is going to close and people need to think about alternatives – not only the amount of energy, but also the employment market, landscape and agriculture, environmental protection and the whole economy of the region are highly affected by future decisions.


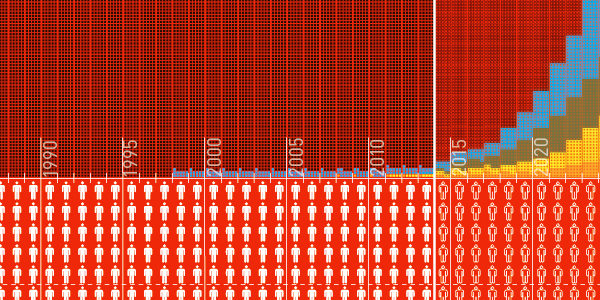
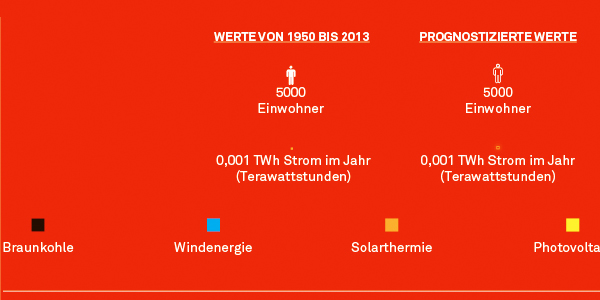
INFOGRAPHIC 1:
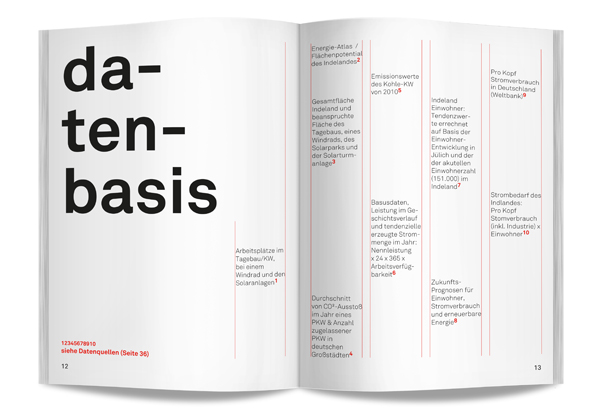
Timeline of population development, energy demand, energy generation of various energy sources and future predictions/perspectives.


INFOGRAPHIC 2:
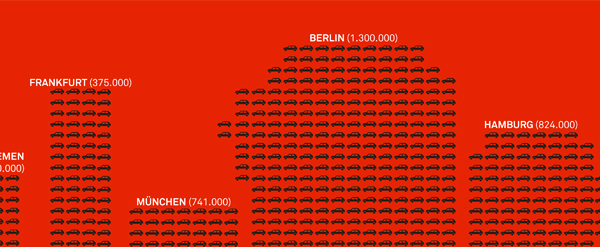
CO2 emissions of the lignite-fired power plant compared with the emissions of all licensed cars of several German big cities. In one year the power plant produces as much CO2 as all of the licensed cars in Berlin, Hamburg, Munich, Cologne, Frankfurt, Stuttgart, Bremen, Düsseldorf, Duisburg, Leipzig, Essen, Bonn, Dortmund, Wuppertal, Nürnberg, Bochum, Wiesbaden, Hannover and Aachen.

INFO BOOKLET