Log In
Discover
Assets
Jobs
Behance
Pro
Hire Freelancers
Download on the App Store
Get it on Google Play
English
Čeština
Dansk
Deutsch
Español
Français
Italiano
Nederlands
Norsk
Polski
Português
Pусский
Suomi
Svenska
Türkçe
日本語
한국어
中文(简体)
中文(繁體)
About
Blog
TOU
Privacy
Community
Help
Do not sell or share my personal information
Sign Up
Skip to Main Content
Skip to Footer
Behance
Behance
Navigate to behance.net
Explore
Assets
Jobs
Behance
Pro
Hire Freelancers
search
magnifying glass
Sort & filter all:
Projects
Images
People
Assets
People to Hire
Cancel
search
magnifying glass
View your notifications within Behance.
View your notifications within Behance.
Log In
Sign Up
search
magnifying glass
Adobe, Inc.
Adobe, Inc.
Navigate to adobe.com
Infographics (Data Visualization)
A moodboard by
Ludvik Herrera
112 Items •
3 Followers
Follow
Moodboard
Following
Moodboard
Unfollow
Moodboard
Free Glassmorphism Presentation & Infographic
by
Oleksii Kolosov
Interactive presentation for UPS Group
Multiple Owners
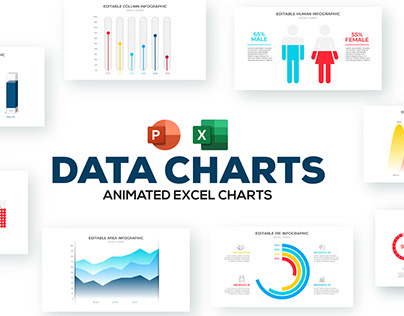
Free Excel Animated Data Charts nfographic
by
Oleksii Kolosov
36 Days of Type 2019
by
BÜRO UFHO
NUMBERS
by
Ítalo Carajá
Navigation for The Ophthalmic Clinic
Multiple Owners
Презентация гида
by
Вероника Мурзина
36 Days of Kinetic Type
by
Syddharth Mate
Geative Creative Presentation
by
Kreev Studio
Animated Creative Studio Presentation Template
by
Angela Santos
Motionly Powerpoint Presentation Template
Multiple Owners
PORTFOLIO
by
Neda Mamo
Learn Something New
by
Eiko Ojala
IPHONE X MINIMALISTIC MOCK-UPS
by
Kheathrow Graphics
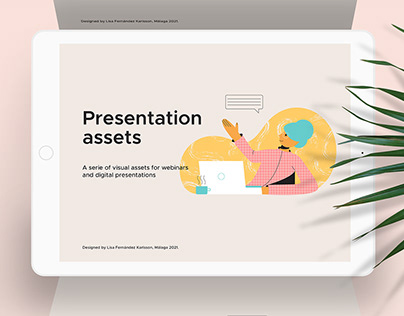
Presentation assets
by
Lisa Fernández Karlsson
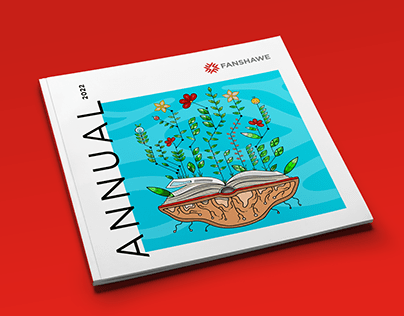
Fanshawe Annual 22
Multiple Owners
Iconic Annual Report
by
yudy firmansyah
Annual Report for Yildirim Group of Companies
by
Murat Helvaci
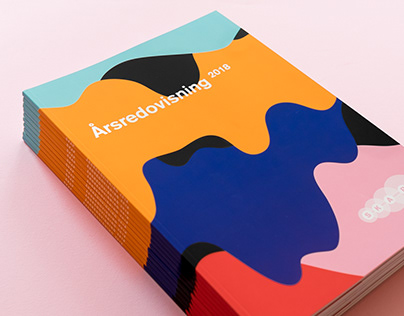
Skap – Annual Report
by
Katarina Fegraeus
Sharing since 1899
by
EIGA Design
Neurama Annual Report 2019
by
creanet
TINY Annual Report
by
Torjan Rood Vastveit
Infographic annual report
by
Miroslava Vomela
Breathe | Pantone Project
by
Dylan Cliff
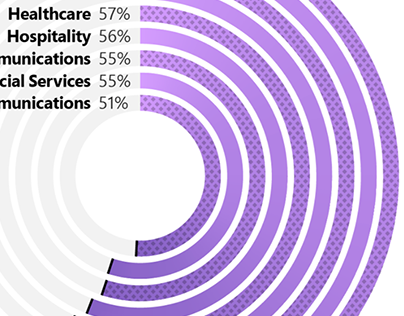
Education Abroad Metrics
by
Liza P.
Data Visualization
by
Hermin Utomo
Wrongful Convictions to death row in the U.S.
by
Sarah Fawson
Infographic Design for Inner Mettle
by
Anabella Gaspar Gandosi
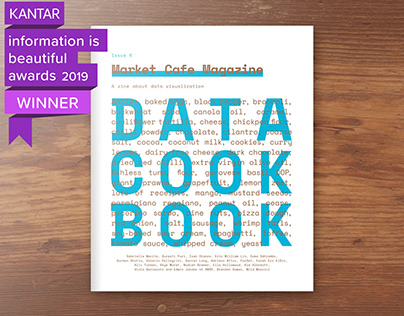
Market Cafe Magazine - A zine about data visualization
Multiple Owners
Poverty (infographics)
by
Karolina Kulpinska
Path to Pandemic / BBC Science Focus
by
James Round
Self Screen Time | Data Viz
by
Pridhi Nehra
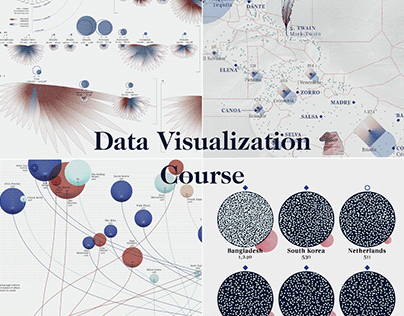
Data Visualization Online Course
by
Federica Fragapane
Women in Parliament and Workplace
Multiple Owners
MICROSOFT - Microsoft WorkLab
by
Valerio Pellegrini
Journals & News Dataviz
by
Jorge Rey
Storms & Hurricanes Dataviz
by
Jorge Rey
Ease - Mental Health Tracking App
by
Gabriella Szabo
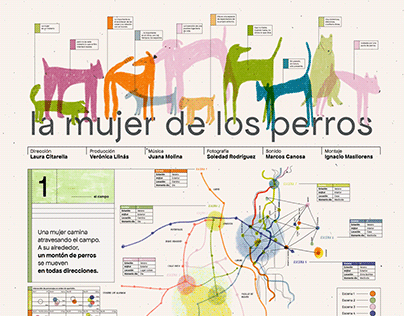
La mujer de los perros - Esquemática
by
Pilar Dibujito
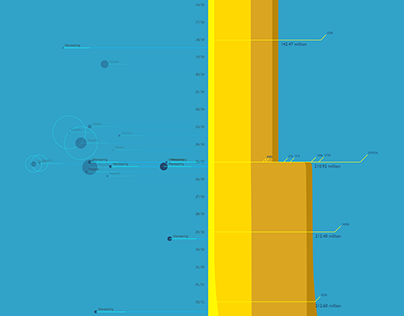
Death at Home - Data Visualization
by
Gabrielle Merite