Dunne Frankowski - Coffee Data Visualisation
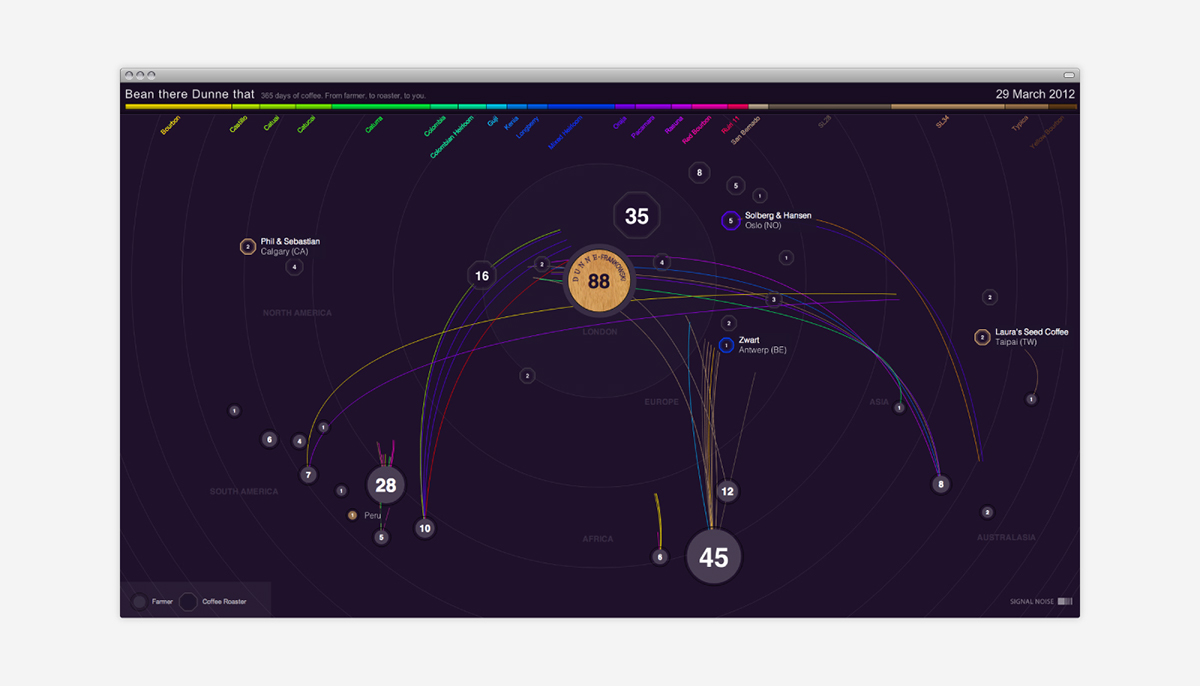
A data visualisation focusing on the process of each coffee shipment made by Dunne Frankowski coffee shop before reaching their coffee house. Based on a one year time span, the speed of the lines represent the transit time, whilst the two different shapes represent the coffee farmers and the coffee roasters. Each coloured lines represents the variety of beans sourced and the seasonal relevance of each varietal.
A large volume of the coffee roasters were based in close proximity to the coffee house. To enhance and make full use of the limited space I designed a polar projection of the globe to show the geographical proximity between the farmers, roasters and the coffee shop.
Completed whilst working at signal | noise.