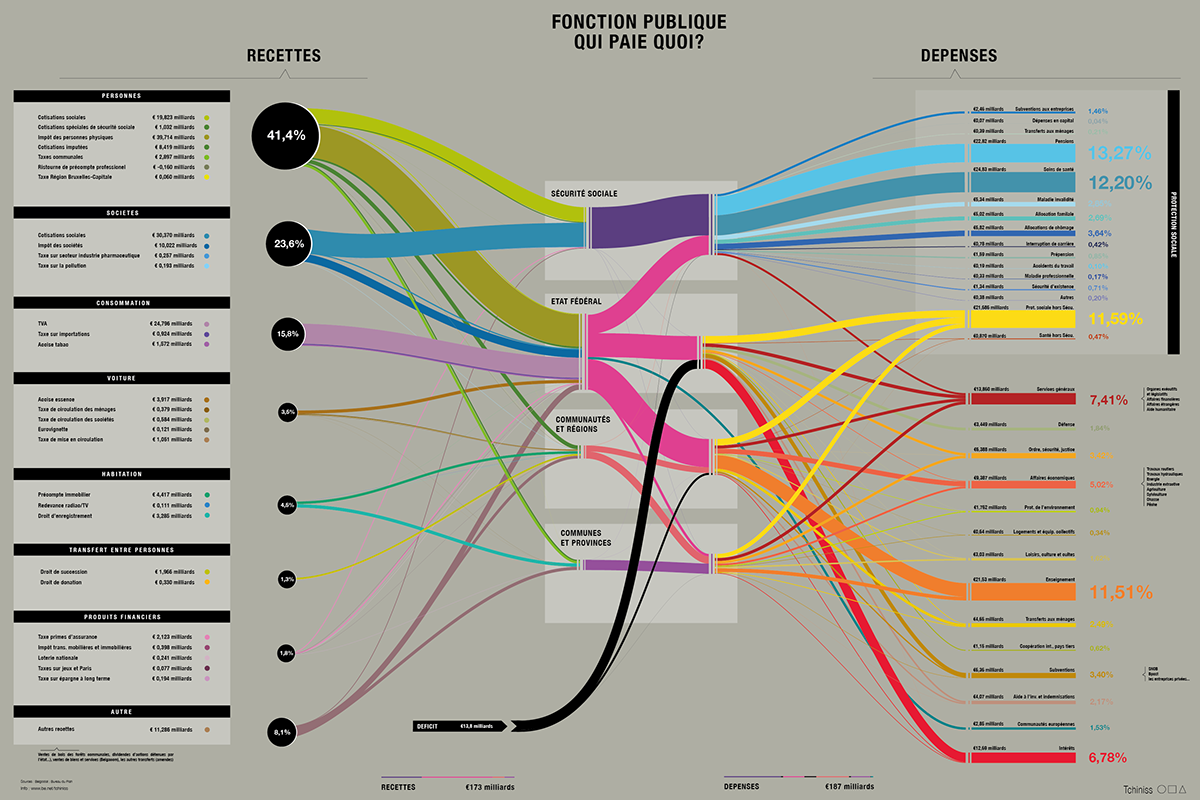
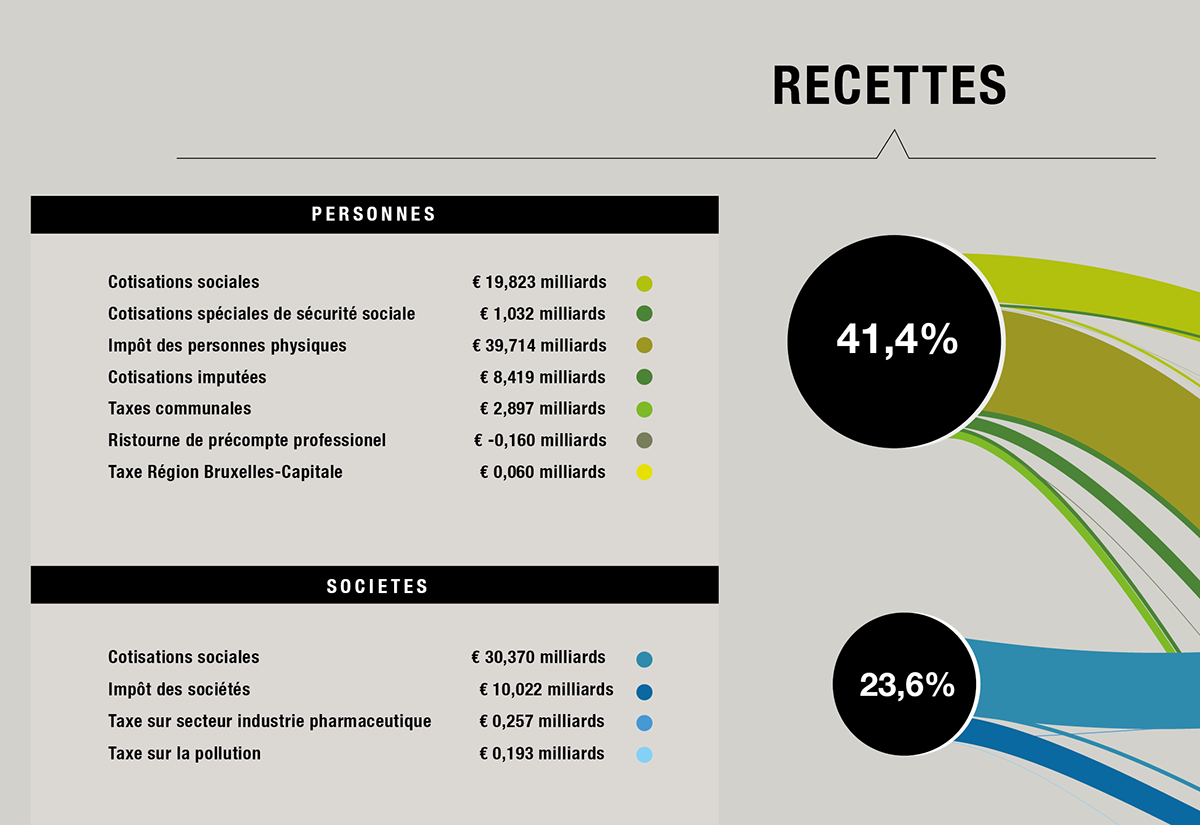
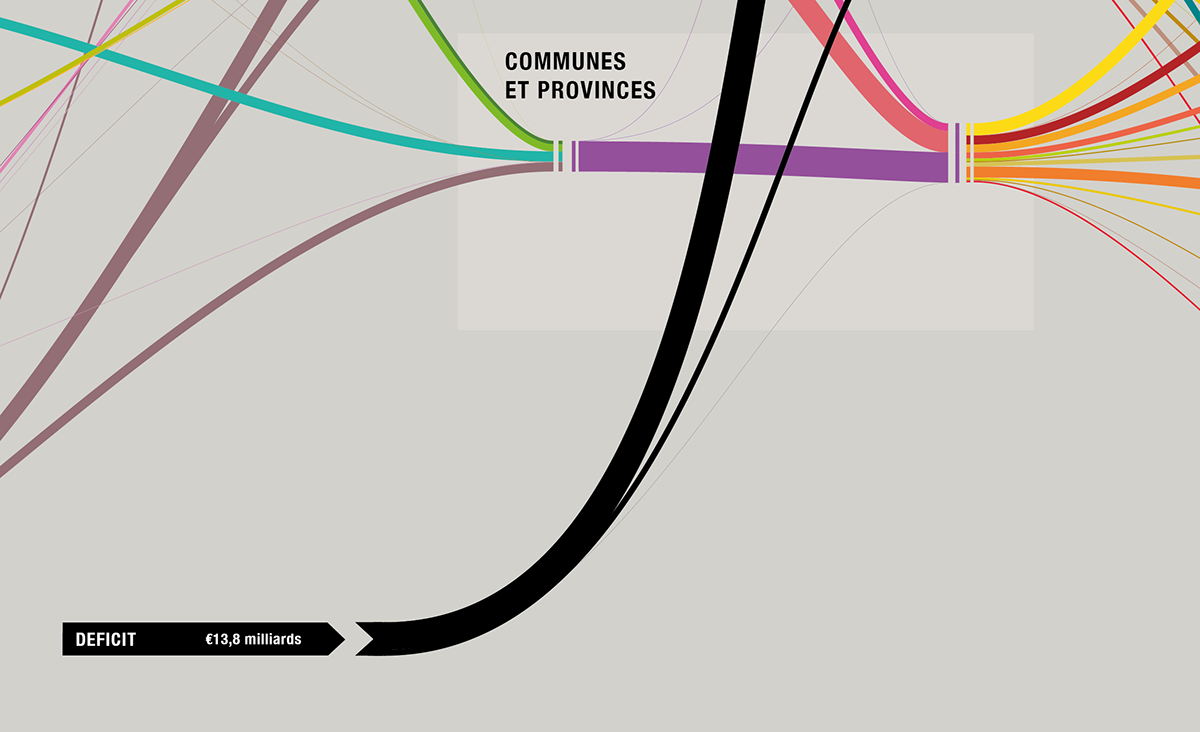
This datavisualisation is illustrating the incomes and outcomes of the differents levels of the belgian state (country, regions, provinces).
L'écho
This datavisualisation has been published in the belgian newspaper : L'écho
http://journal.lecho.be/ipaper/20130126#paper/echosupplement/2
Dataviualisation.fr
It has also been described and discussed on the website datavisualization.fr mainly concerning the Sankey diagram approach
http://www.datavisualization.fr/blog/2013/02/who-pays-what-.html
HD resolution : http://www.datavisualization.fr/files/who-pays-what.pdf