
Infographics created for Cancer Research UK Charity. Whole project is based on statistics data produced by this company. My infographics are mapping avoidable causes of cancer.
In my opinion aforesaid company's infographics which are currently in use, are using too many colors and too many shapes, i have tryed to settle whole chaos down by using only one colour with shades of grey.
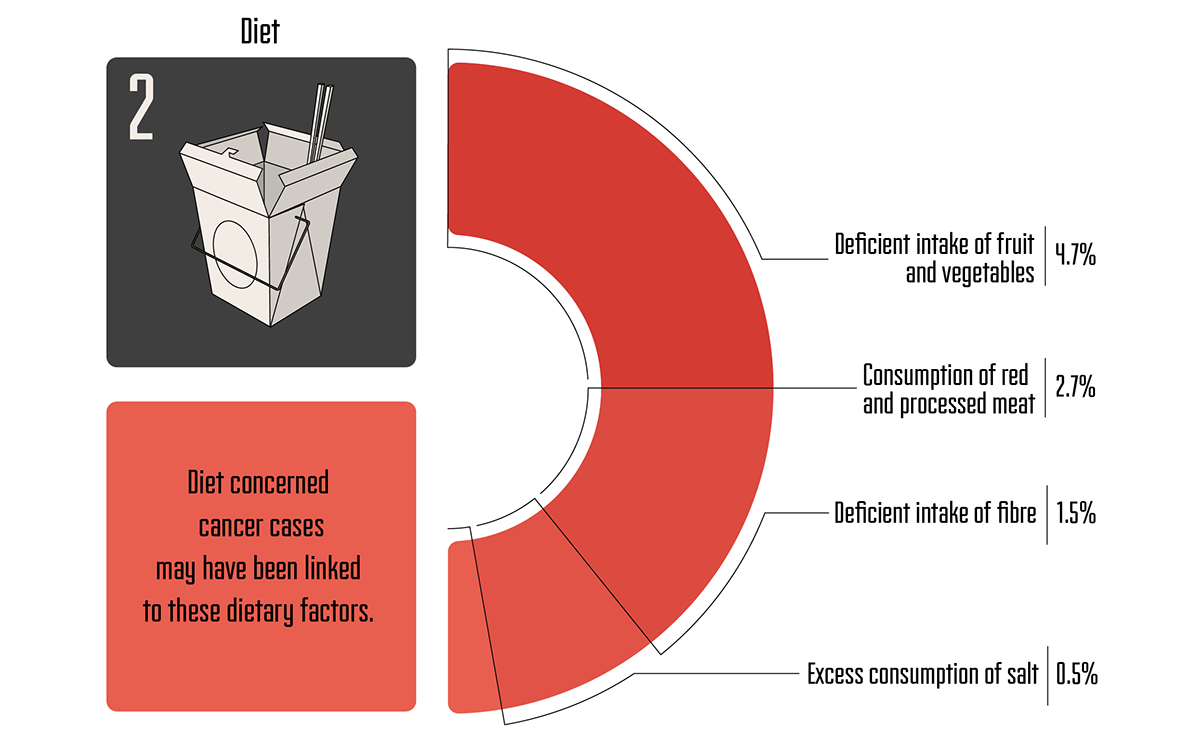
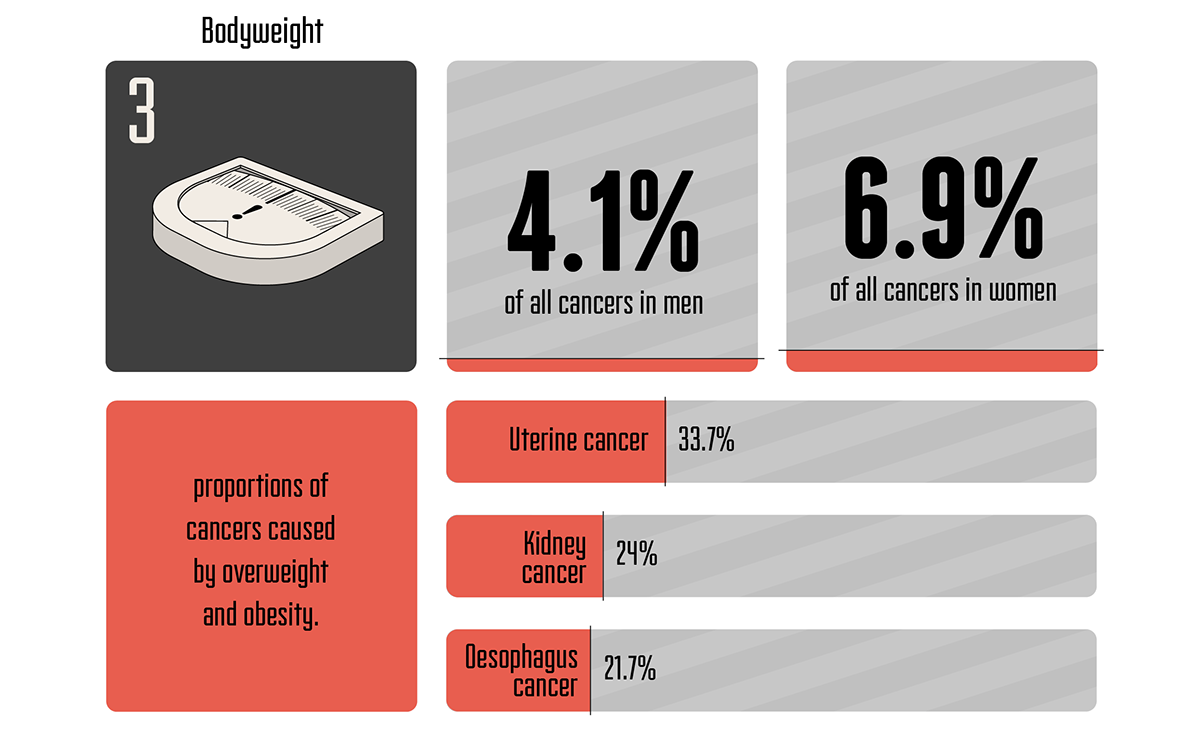
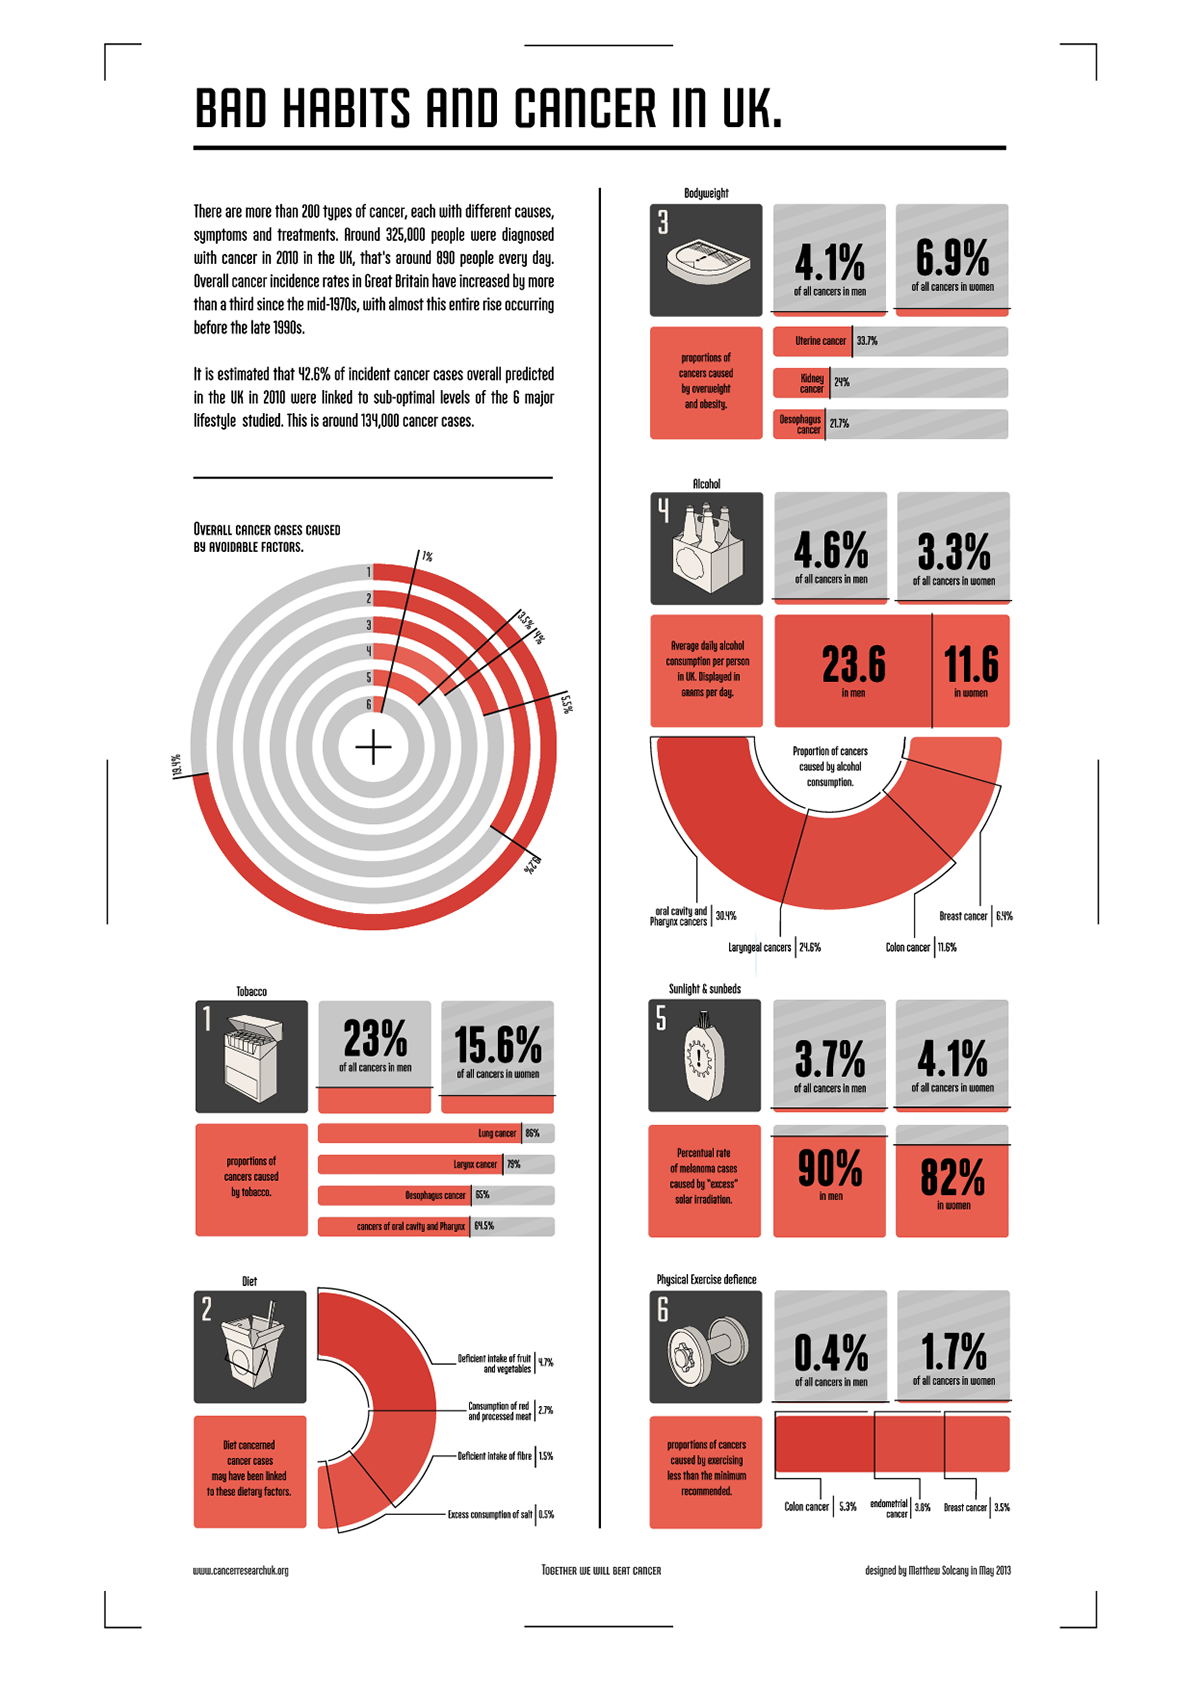
There are more than 200 types of cancer, each with different causes, symptoms and treatments. Around 325,000 people were diagnosed with cancer in 2010 in the UK, that's around 890 people every day. Overall cancer incidence rates in Great Britain have increased by more than a third since the mid-1970s, with almost this entire rise occurring before the late 1990s.
It is estimated that 42.6% of incident cancer cases overall predicted in the UK in 2010 were linked to sub-optimal levels of the 6 major lifestyle studied. This is around 134,000 cancer cases.


When each "module" was finished, I set all of them them into poster composition. (I'm sorry for crappy quality of poster, I've tryed everything to make it better, alas with no avail.)
In case you enjoyed my project, please leave feeedback and, or appreciate. Thank you for your time!


