

Carbon Time Crater – physical data visualisation
Carbon Time Crater is an interactive, physical data visualization which shows the global CO2 emissions and the CO2 emissions of the five world regions: OECD, Asia, Latin America, Middle East/Africa and the Reforming Economies. An explorative and playful object has been created which lets you slide through the development of the CO2 emissions in the next 100 Years considering five different scenarios (SSPs).
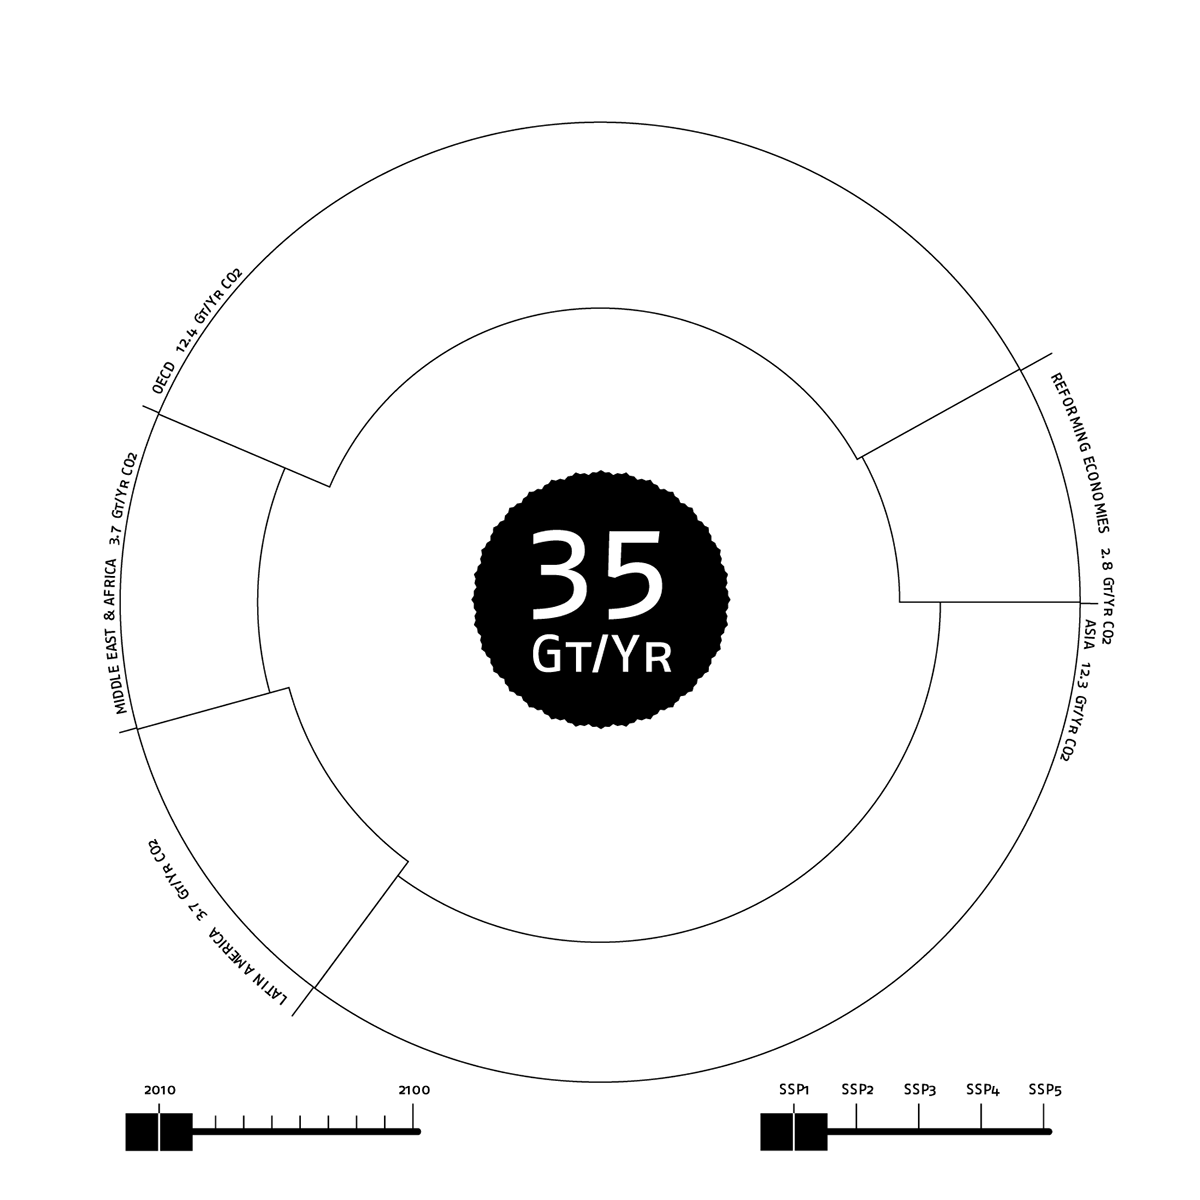
The dynamic crater filled with black sand in the middle of the object presents the global CO2 emissions. It is surrounded by a projected visualisation that shows the C02 emissions of the OECD states, Asia, Middle East and Africa, Latin America and the Reforming Economies. The radial length stands for the CO2 emissions of the regions and the height or the sinking into the crater for the CO2 emissions per capita.


