The following is an excerpt from my MAA thesis I wrote at Emily Carr University of Art + Design. Full thesis is available here: http://ecuad.arcabc.ca/islandora/object/ecuad:2741
Thingogram is a series of works that explores acoustic properties of objects. The general idea is that every physical structure can be uniquely described as a list of frequencies with corresponding amplitudes. In Thingogram v.1 I analyze objects the same way as I would analyze the brain. Similarly to how the brain produces certain patterns for certain conscious states, physical matter produces a certain pattern for a certain physical state. If consciousness really has an integral relationship with matter, as is the case in monistic idealism, could these frequencies help us understand the translation process between mind and matter? Perhaps the frequencies emitted by consciousness are directly affecting the state of matter. To me, this seems reasonable because objects of our own creation cannot exist unless we think of them first.
In the first version of Thingogram, I focus on the construction of a method to extract lists from different objects and the translation of the lists to an image. This image would reveal the pattern unique to each object. In the second version, I construct an algorithm based on fractals and fibonacci sequences that takes an image from the previous version as an input and outputs an audio representation of the spectral image acquired from the object. In the third version of this ongoing series, I built a physical framework for the components of v.1 and v.2. This version is a collection of spectral images of objects and the sounds they generate. Here, my challenge was to give the content a viewing platform. My initial approach was to make a book with an interactive audio component but this evolved into a portable collection of images and embedded systems that support the audio playback for the sounds produced by each image.
Thingogram v.1 is a method to look at the frequency spectrum of physical objects in a controlled environment. When selecting the analyzed objects I considered a number of aspects. Each object needed to be below a certain size to fit the physical dimensions of the experiment and have a distinct shape and texture relative to other selected objects. I am certain that the experiment can be scaled up to allow for analysis of larger objects, but here my primary interest is the relative difference in the frequency spectrum of different objects.
Keeping in mind that anything only exists relatively to something else and is dependent upon its environment to be meaningful I knew I had to find a way to detect the change induced to the environment introduced by the object in question. I did this by creating a setup in which a speaker and a microphone are located on opposing ends of an empty space. Knowing that audible sound operates in a range of measurable frequencies, I instructed the computer to send a white noise signal through the speaker. It is a special kind of signal, because it is composed of all frequencies at equal amplitudes. White noise is commonly associated with the static on a television monitor, or the buzzing sound a radio makes when it is tuned in between radio stations. When we either listen to or look at white noise, we perceive no significant connection between what seem to be randomly generated points. When the white noise signal travels through the empty space and hits the microphone the signal has been distorted to a degree by the surrounding space the equipment itself. For this reason I record the signal without an object in the space to use as a comparison signal.
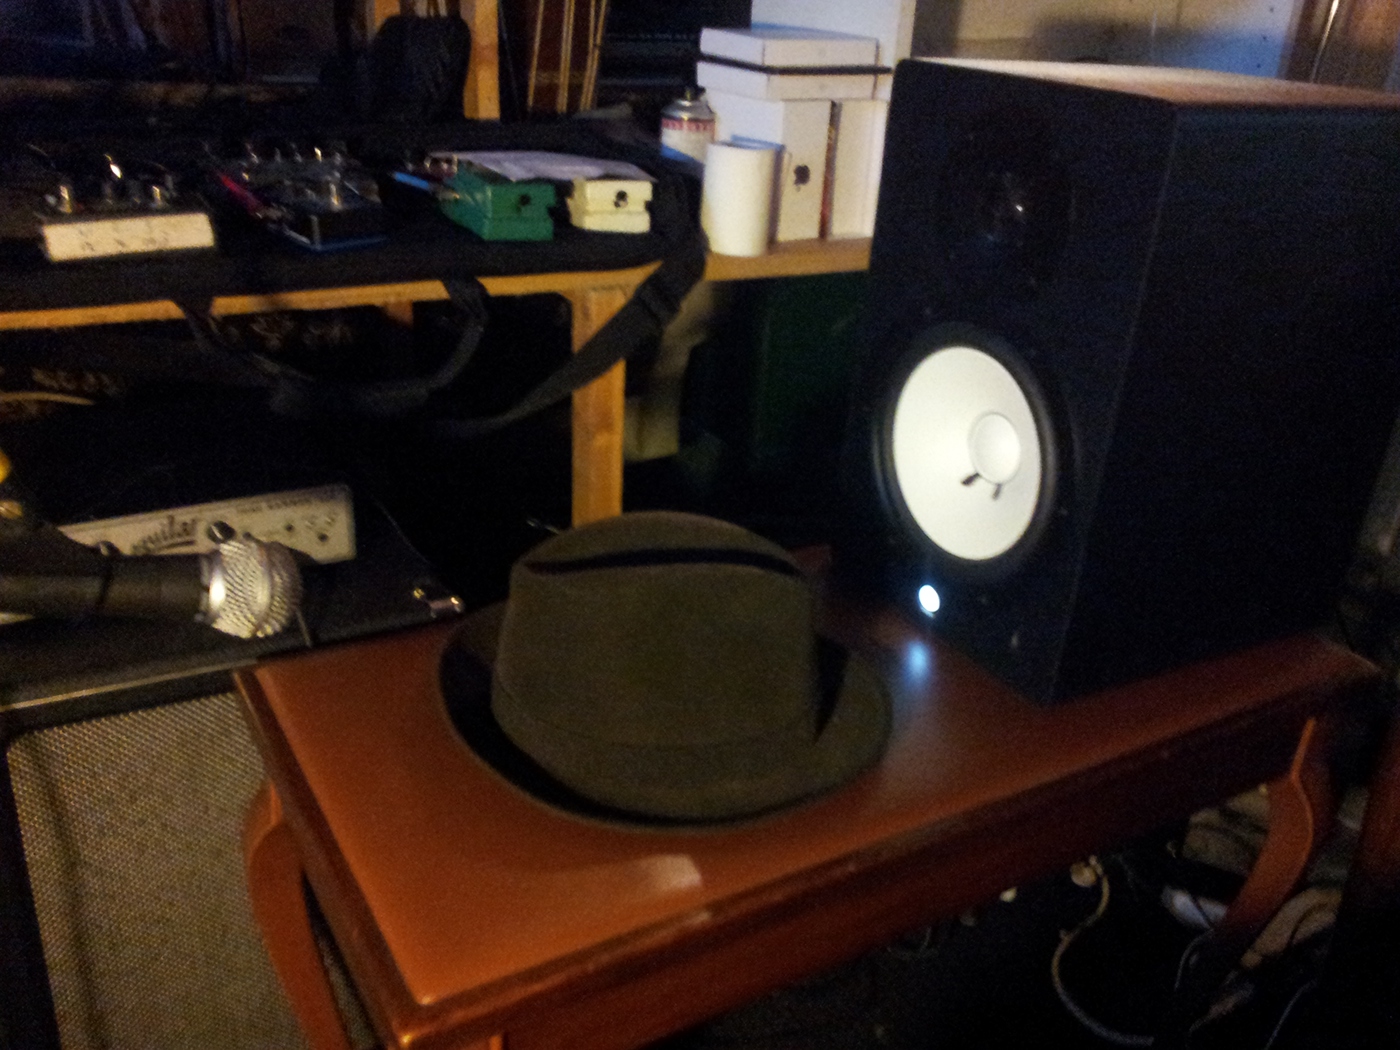
Here, I am recording white noise filtered by a hat.
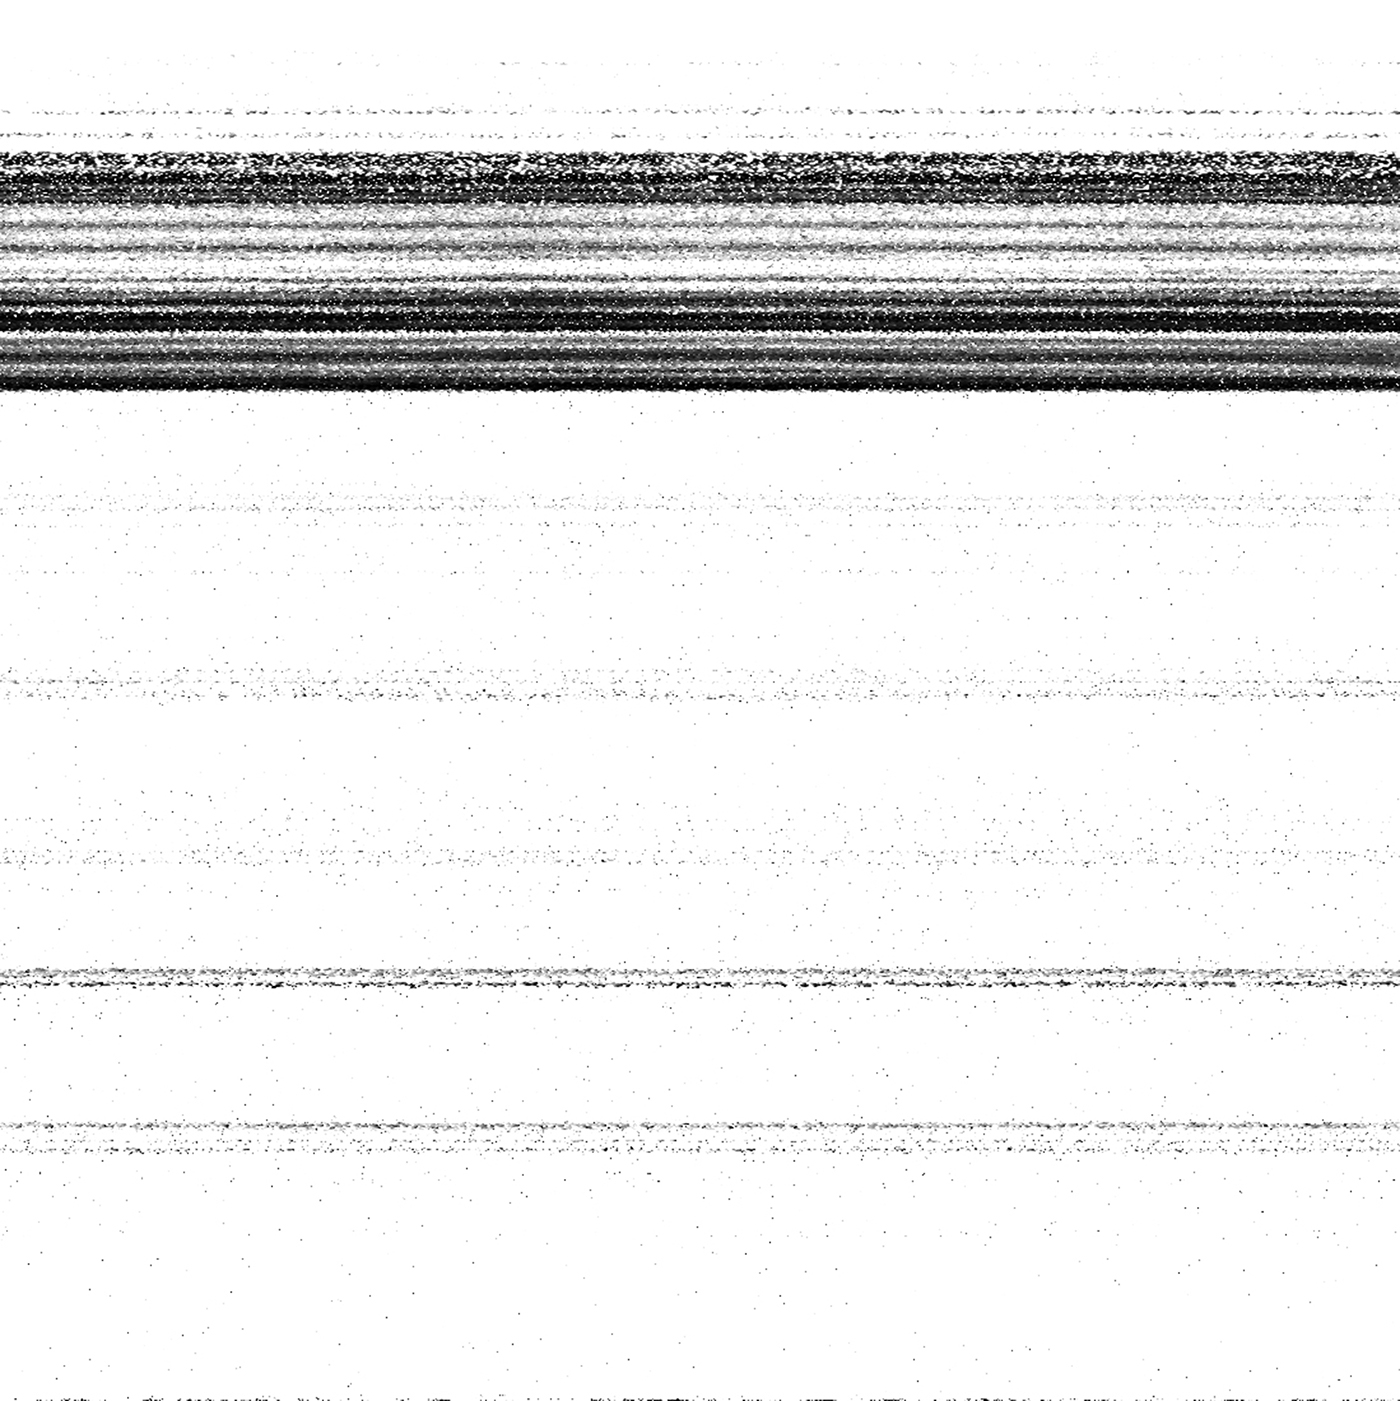
Now a second recording is made in the exact same way, but with an object inhabiting the space. When the white noise signal travels through the space, some of the frequencies are blocked by the object affecting the recorded signal. Now both recordings are converted to images (spectrograms) and the image representing empty space is subtracted from the image depicting the object in the space. This effectively subtracts the empty space (and other factors) from the object in the space, leaving only the frequency bands affected by the object. The result is an image that shows frequency bands absorbed by the object. When the process is repeated several times, placing different objects in the empty space, the produced images reveal clear spectral differences between each of the objects. It is evident that similarly to conscious states, physical states can also be described in terms of frequency and amplitude. In fact, mental states as understood here are physical states. Could there be a way to affect these physical states with the mind through the use of technology?
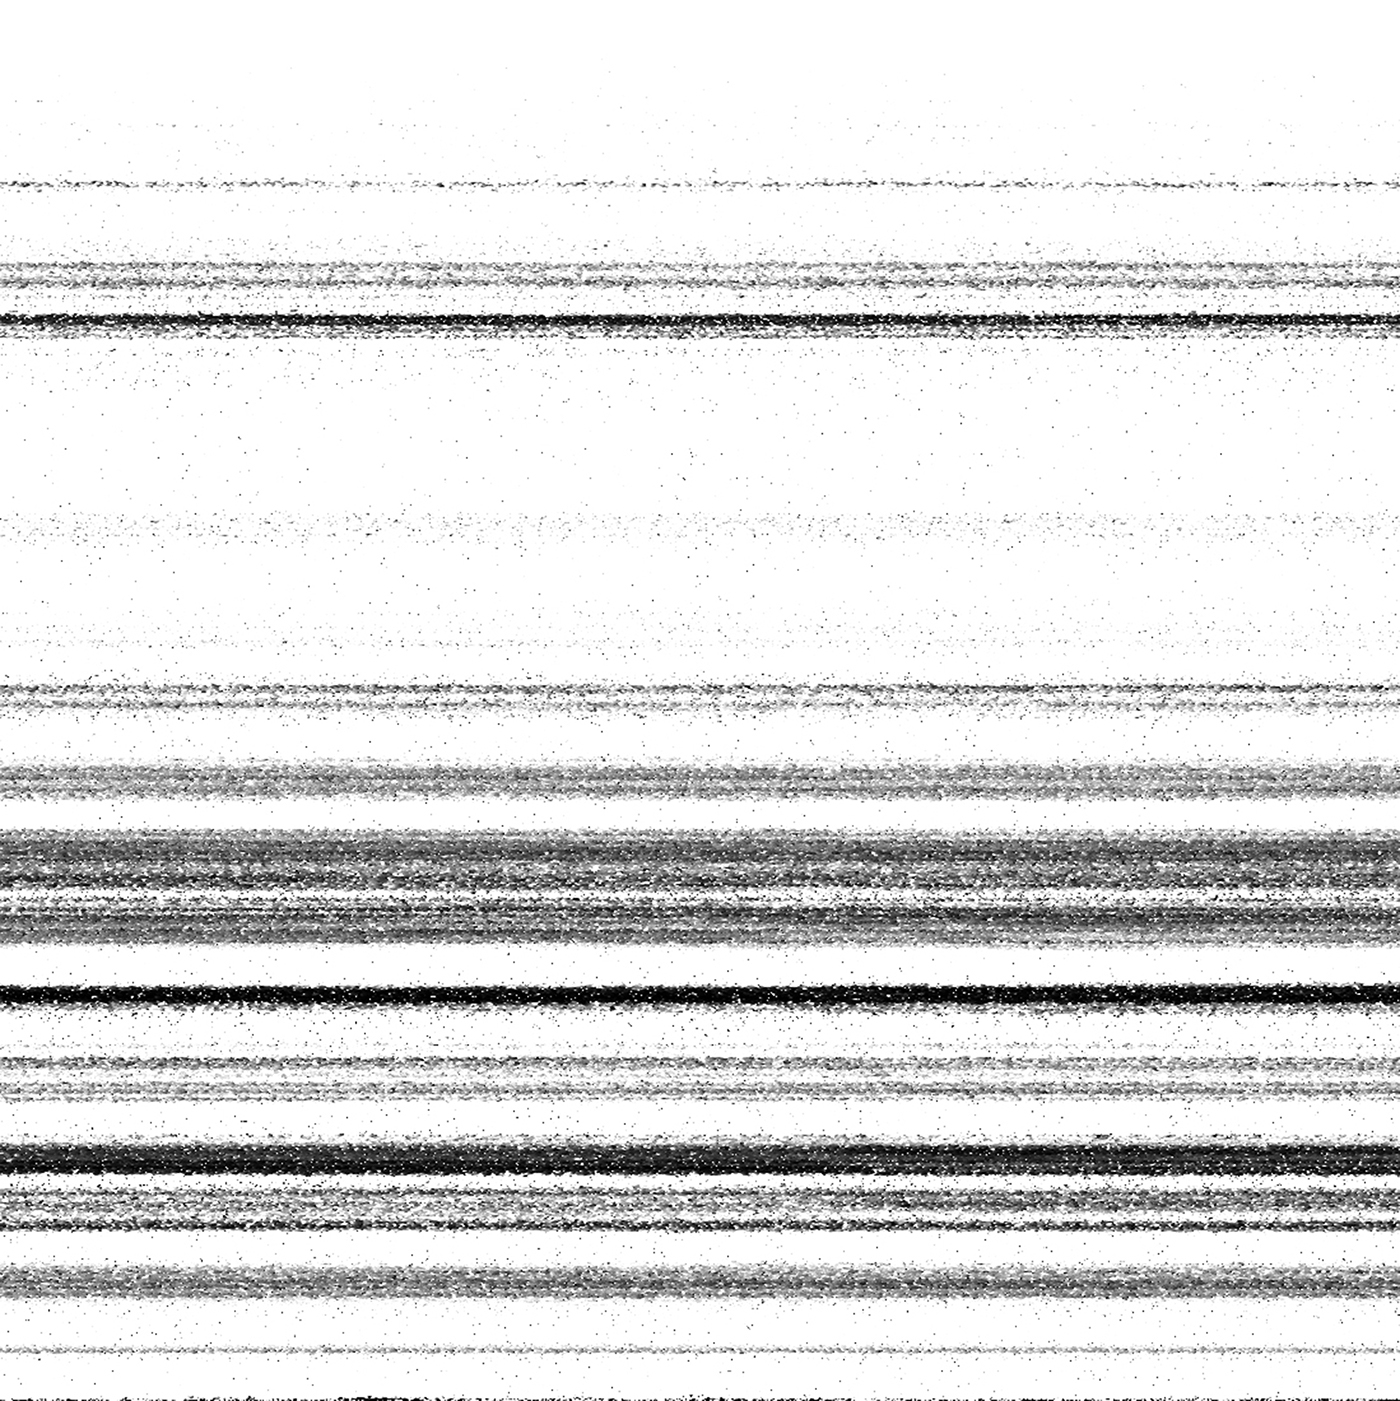
This is a spectral image of the hat pictured above.
This is a spectral image of a glass.
At this stage I had developed a process to visualize the acoustics of an object but I had no way of listening to what the objects sound like. In order to achieve a way to do this, I built an algorithm that reads images and translates individual pixel location and density into an equivalent frequency and amplitude of a sinewave. Fourier transformation can be applied to extract data, but it is also possible to reproduce the original data using only the basic building blocks of the original. Building on this idea I started to program a hierarchical system of sine waves. The original approach was to create one sine wave for each specific frequency in the audible range - so I would have to instruct the computer to create 20.000 individual sine wave signals and adjust the amplitude of each one according to pixel density in the Thingograms. This is a very high number of operations that needs to be calculated simultaneously and would require too much processing power.
To address this issue, I started constructing an algorithm based on fractal Fibonacci sequences I am calling the Natural Sound Synthesis Algorithm (or NSSA). Considering that humans are biological entities that share mathematical constants with the rest of the natural world and that these numerical relationships are known I concluded that this would serve as a basis for encoding spectrograms into sound with a more naturally sounding result than a traditional Fourier transform. Instead of instructing the computer to create each individual frequency, I instructed it to only generate frequencies that are multiples of Fibonacci sequences. This way, the frequencies are distributed along a natural path and despite the resulting signal containing fewer frequencies the result would sound more natural.
The resulting program, written in Max MSP - a visual programming language, contains 2000 sine waves instead of the initial 20.000 needed for accurate reconstruction. The results are very pleasing to listen to, as expected, and the sound has a surprisingly rhythmic quality. To me it sounds like a constant rhythmic acceleration, where each beat contains several more cycles within. When the cycles overlap they produce a magnitude of interference frequencies, producing a more complex signal. The images produce different sounds, but they are all variations of the constant rhythm inherent in the fractal fibonacci sequence.
Now that I had developed the image and audio components of the work, I wanted to compile them into a portable collection. My intent was to give the viewer a chance to interact with the work and discover the relationship between visual and sonic elements of the documented objects. Furthermore, I wanted to convey the feeling that the apparatus was thinking and possessed some kind of consciousness or artificial intelligence.
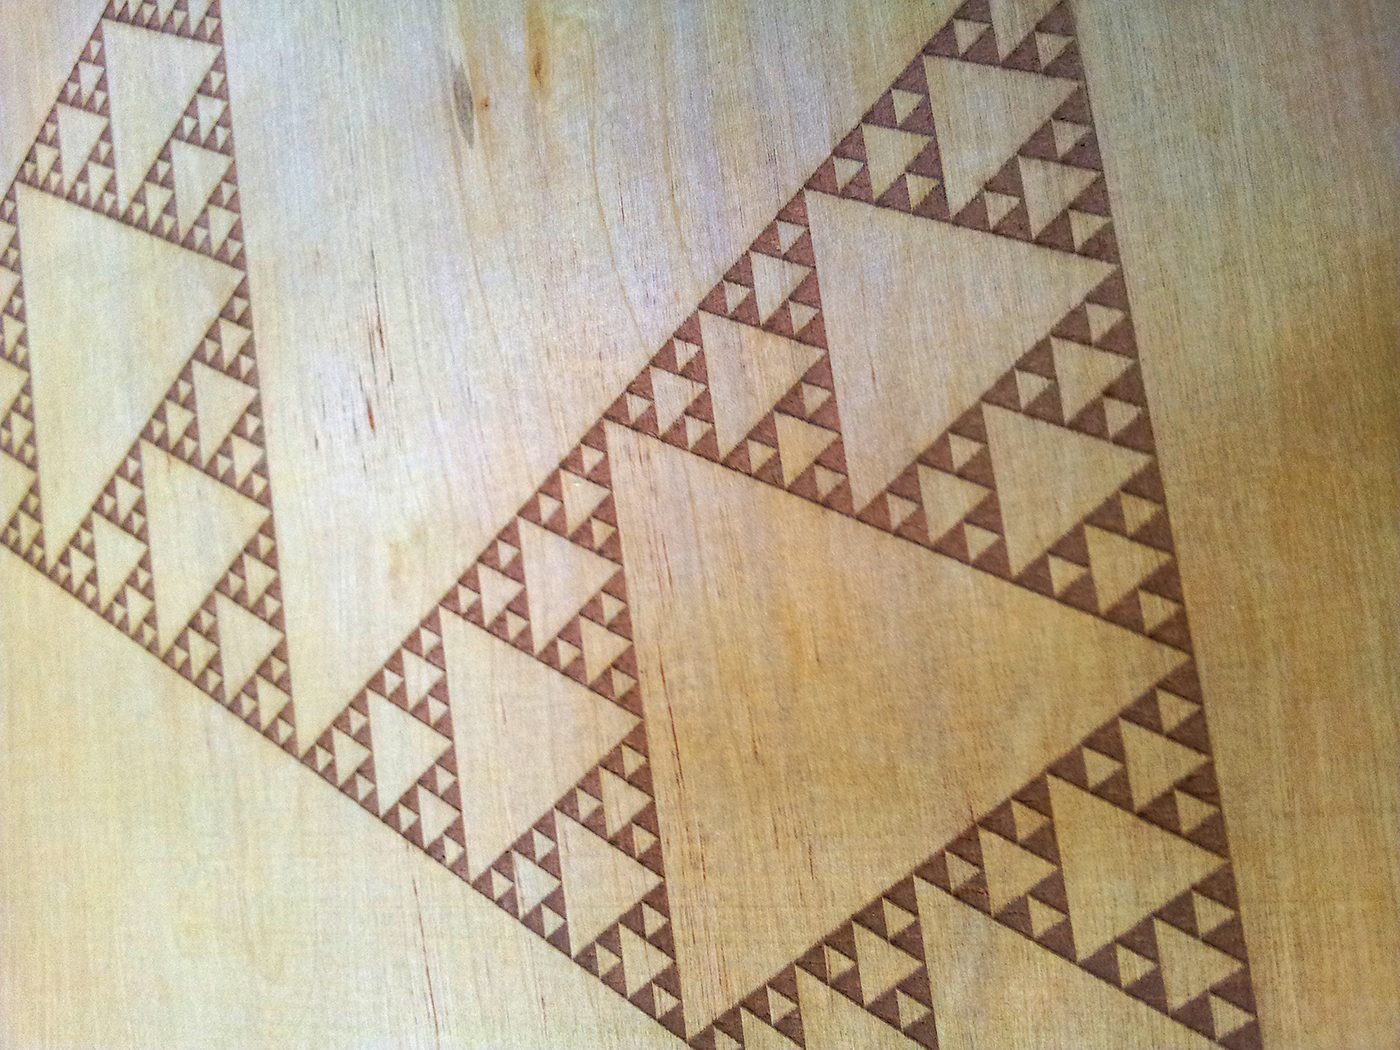
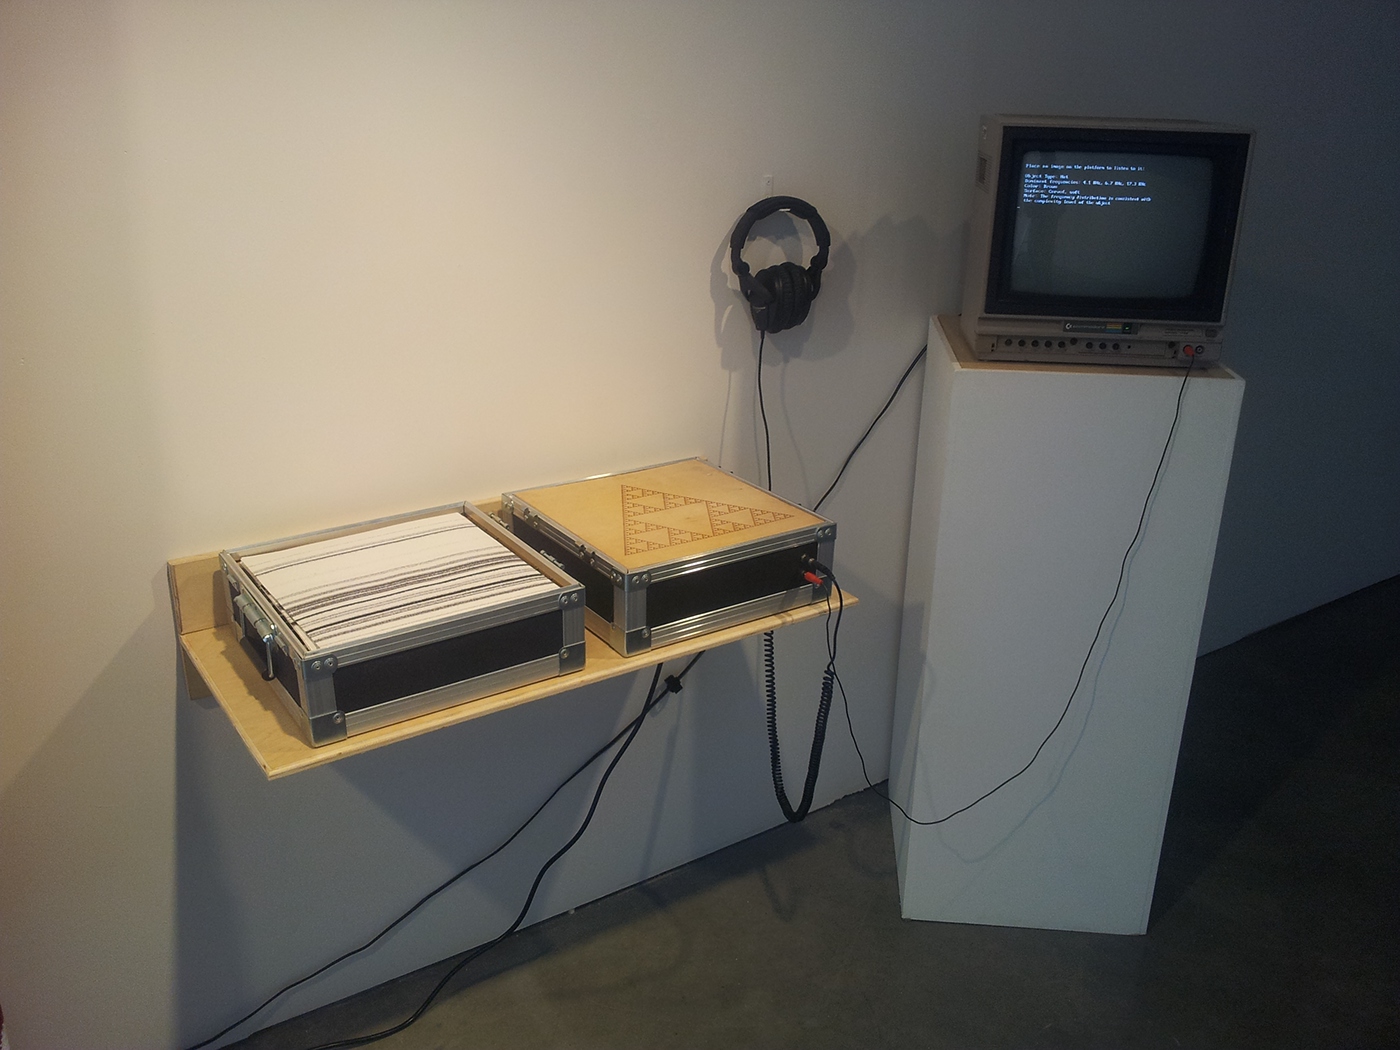
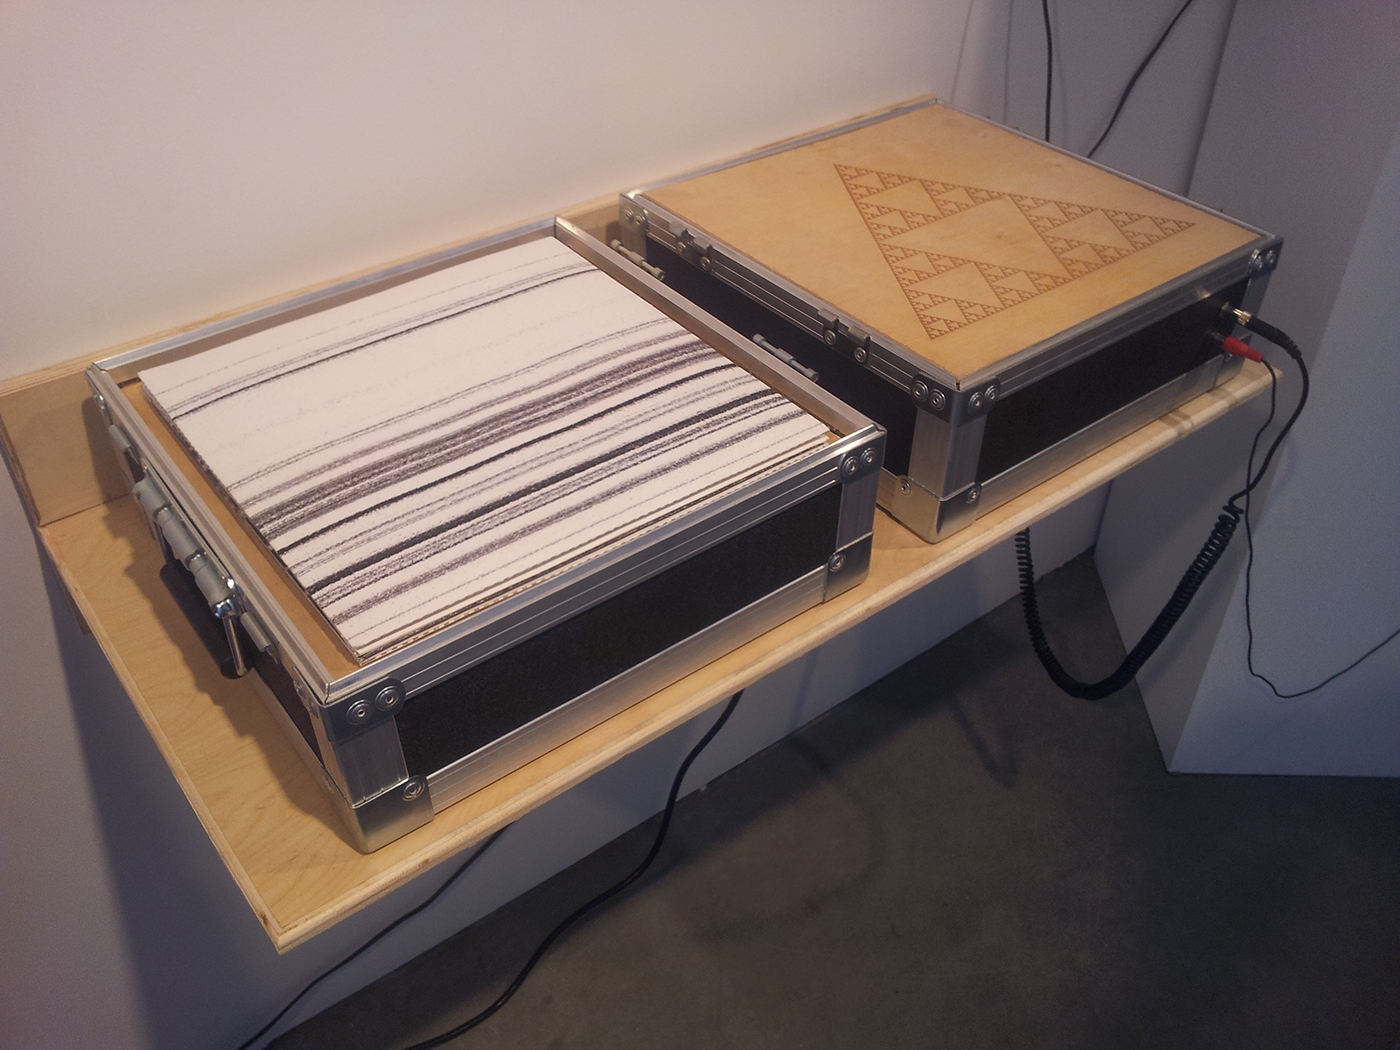
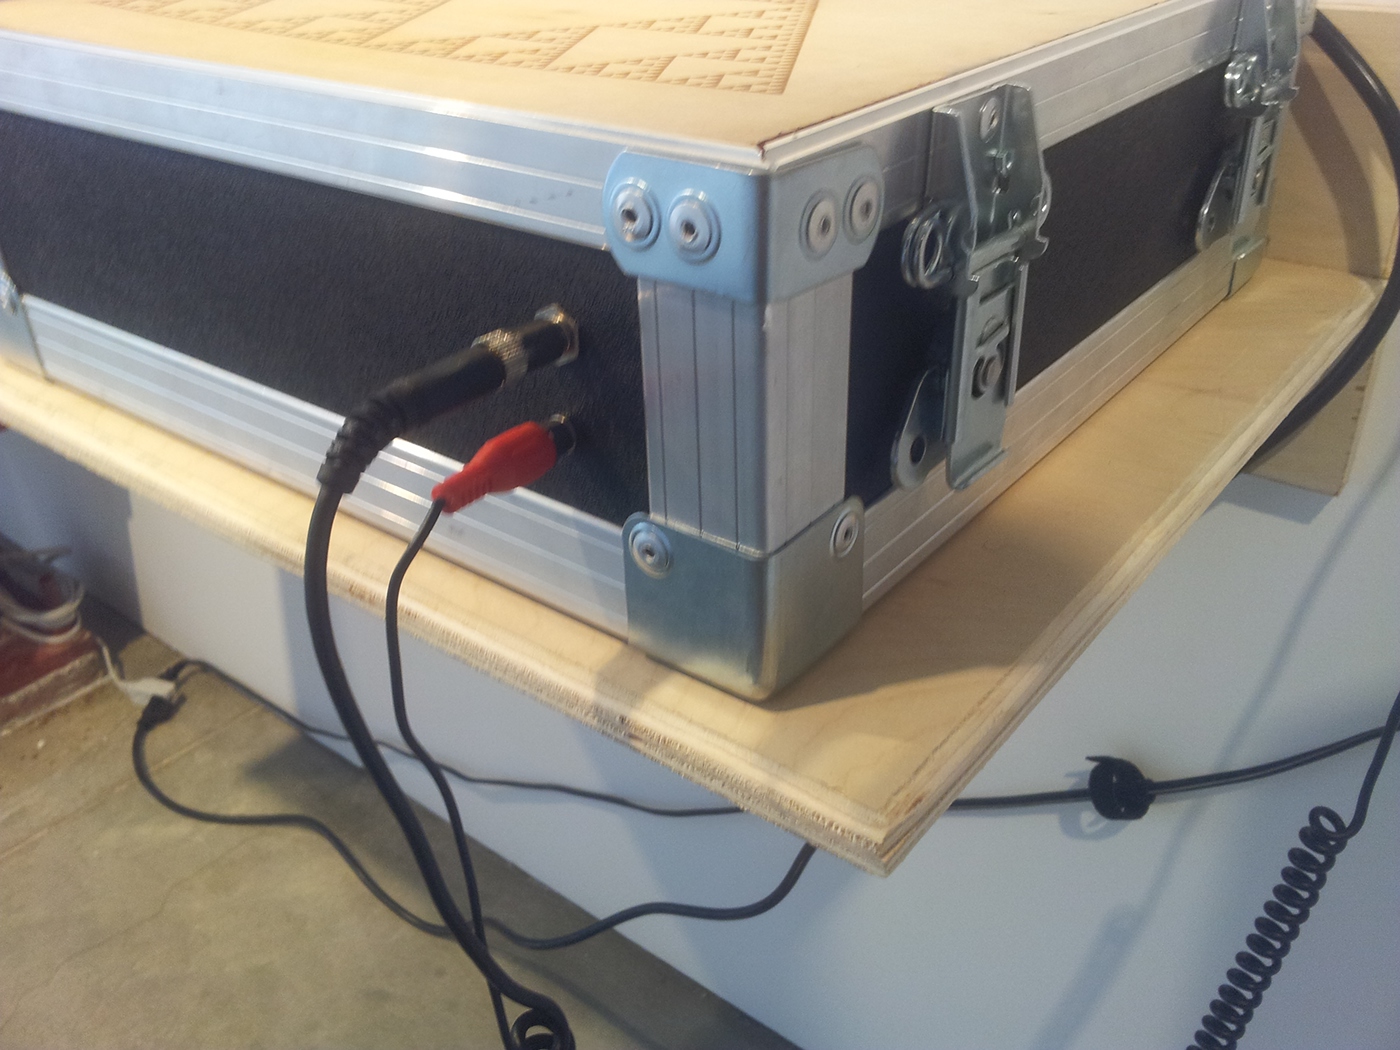
The artwork is installed into a flight-case, traditionally used to ship audio and music equipment. The cuboid case is built with reinforced corners and edges that protects the work while it travels to it's next site of exhibition. It is built to fit 12" record albums in one side of the box and all the necessary electronics in the other. The electronic components of the work handle the interaction with the viewer but are concealed by a plywood cover engraved with Sierpinski's triangle. The only indicators that anything is hidden within the box are the headphone and video outlets on the front of the case and the power socket on the backside.
In addition to headphones, a cable runs from the video outlet to an old Commodore 64 monitor. The monitor instructs the viewer to "Place an image on the platform to listen to it", vaguely suggesting that the viewer places an album cover on the fractal triangle. The fractal pattern engraved on the platform points to the structure of the audio signal.

The images on the albums are components from Thingogram v.1. They are spectral representations of an object. When an album is placed on the viewing platform the monitor starts to intermittently display text-based information about the object depicted on that particular album while playing a fractal audio translation of the image.
Thingogram v.3 functions very much like a traditional record player. It has a compartment containing a collection of records and a separate platform for playing them. I chose to engrave the listening platform with Sierpinski triangle because it symbolizes the relationship between structure and randomness; the randomly generated white noise signal used to record the depicted objects and the structured output of the NSSA. When the viewer places an album on the centre the triangle, an antenna hidden underneath the platform detects a radio-frequency ID (RFID) tag embedded in in center of the enclosed 12" record. An internal Linux computer (RaspberryPi) detects the image ID and plays the corresponding audio while the computer monitor displays pieces of technical information about the object. A new line is displayed every 2-3 seconds and the screen is cleared when the audio stops playing after about 17 seconds. The first few lines are technical observations of the object but this evolves into subjective and parascientific remarks. This is my attempt to guide the viewer towards the idea of artificial intelligence and evoke thoughts about consciousness in the artwork.


