FollowFollowing
Appreciate
Livability Report

Livability Report
Published:
Livability Report
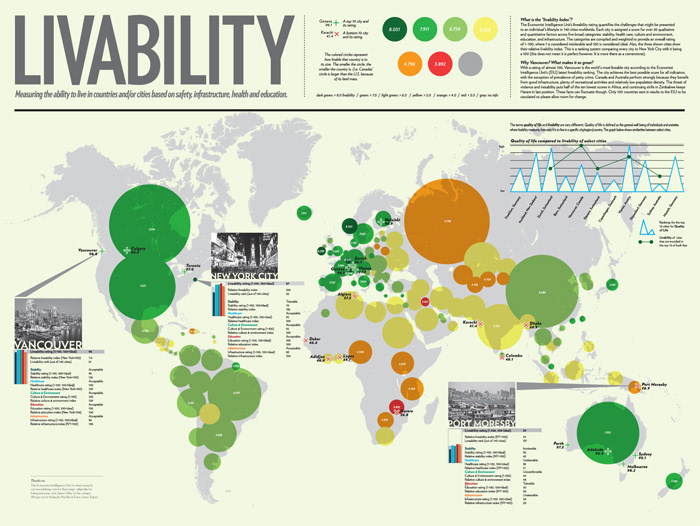
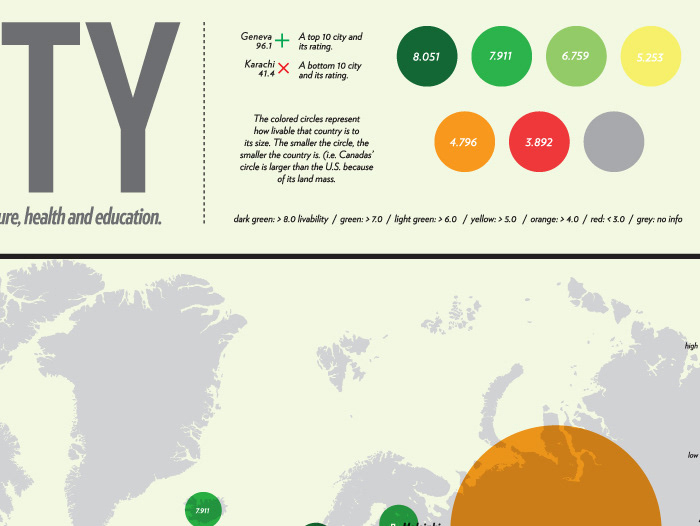
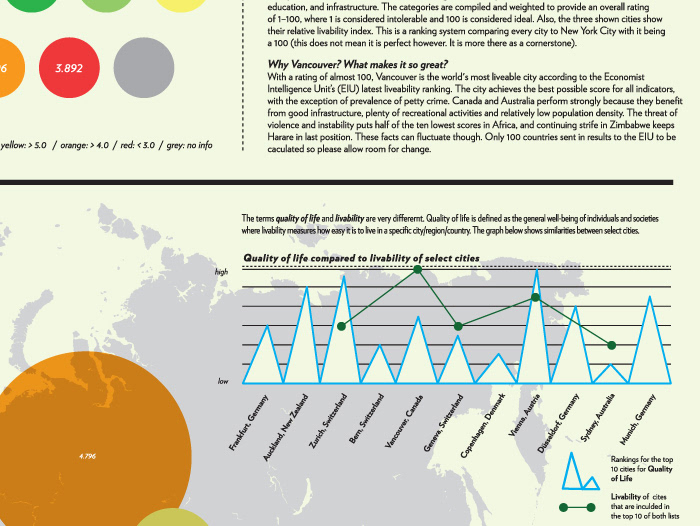
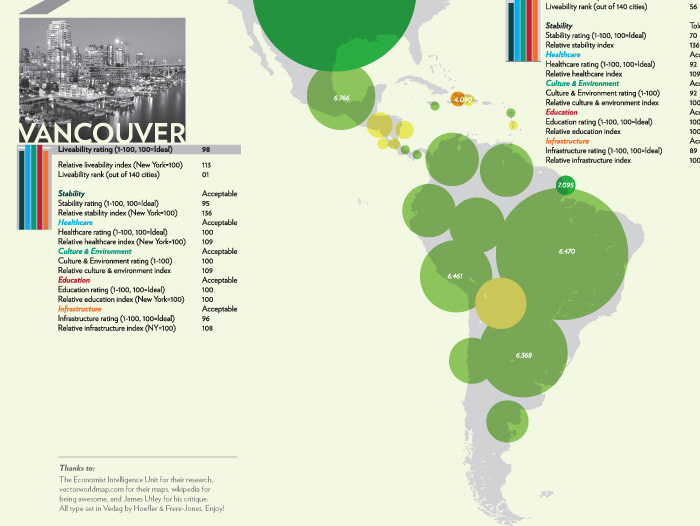
An information graphic I created (with the help of statistics from the Economist Intelligence Unit) on the livability of select cities around the Read More
0
Published:

