The Design Surgery Infographics 2011
Raconteur / The Times Newspaper Data Visualisation
Raconteur / The Times Newspaper Data Visualisation
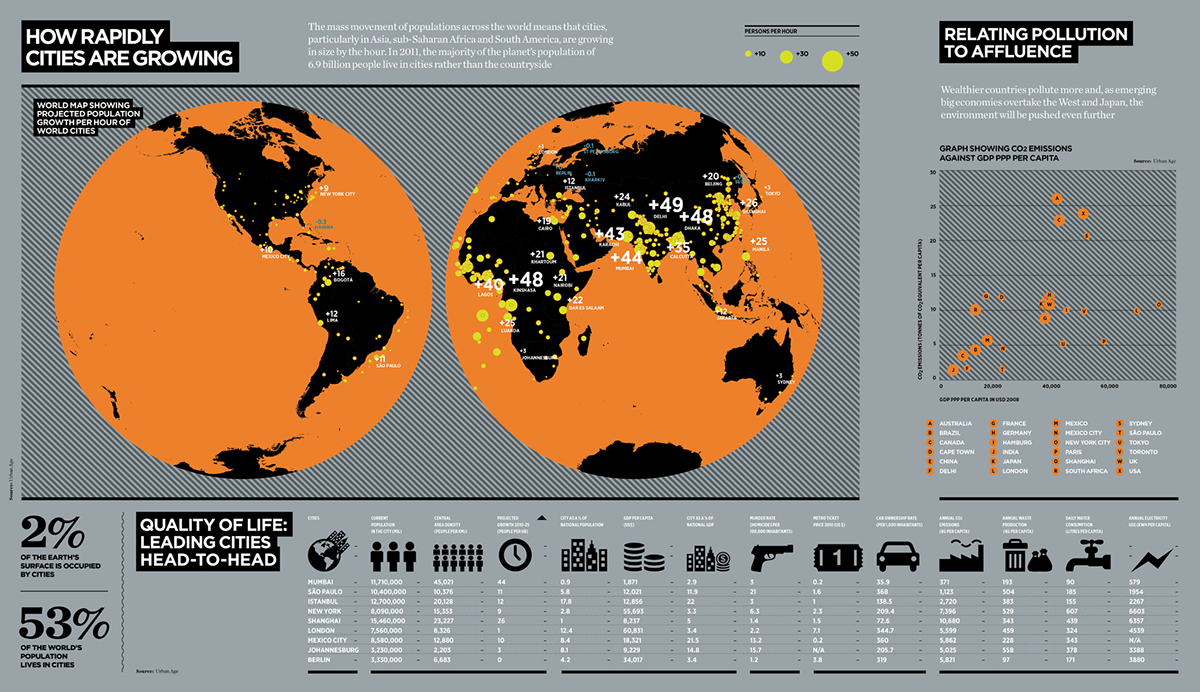
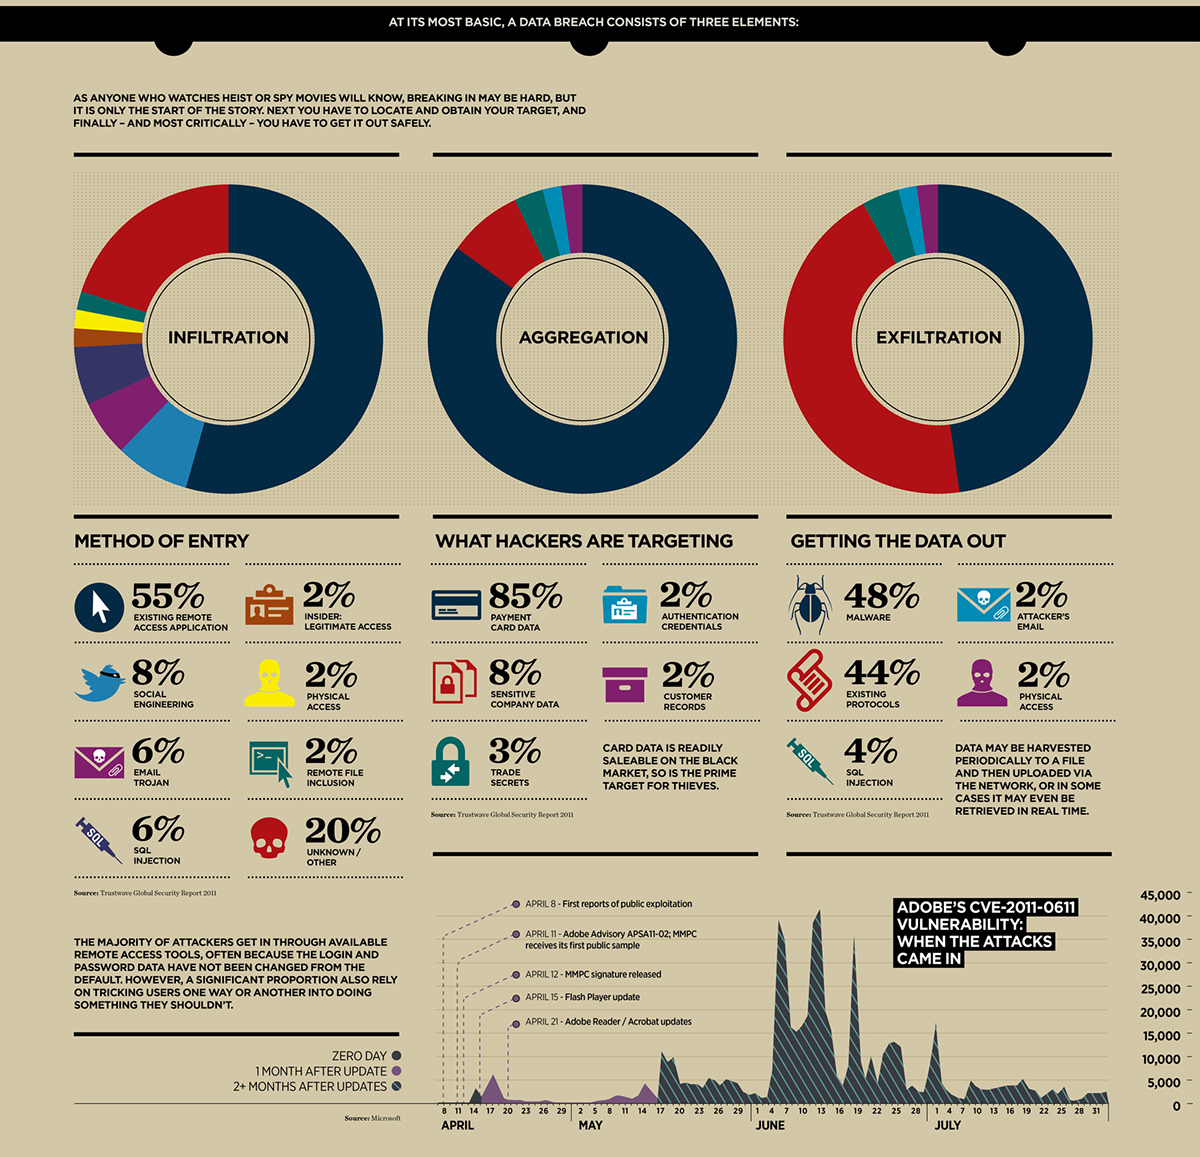
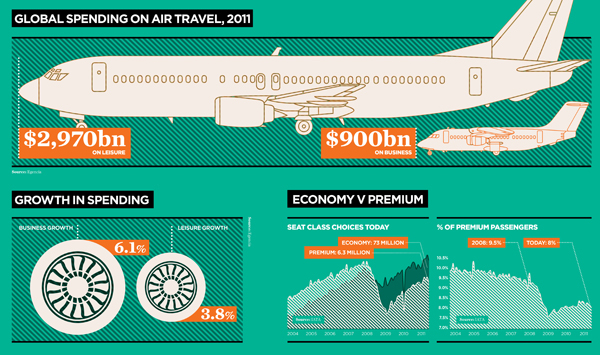
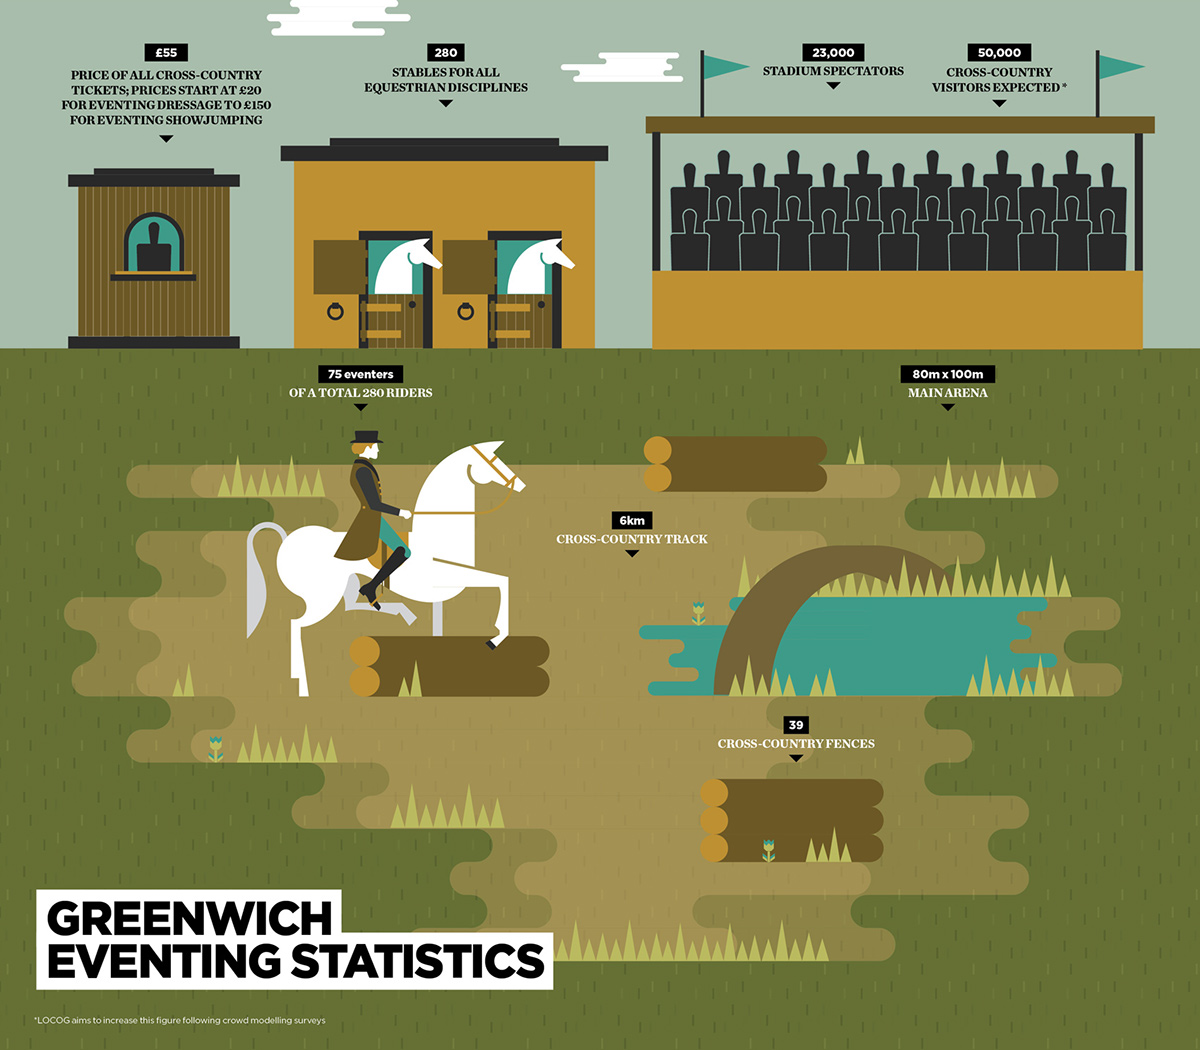
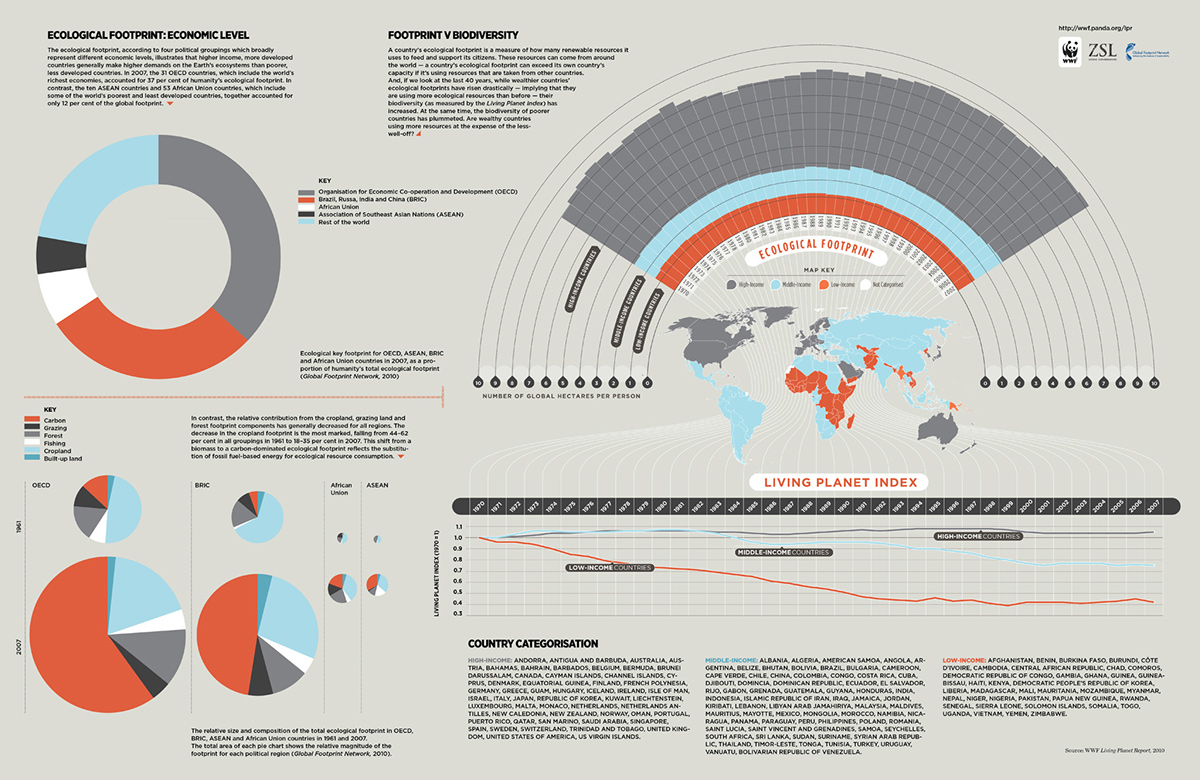
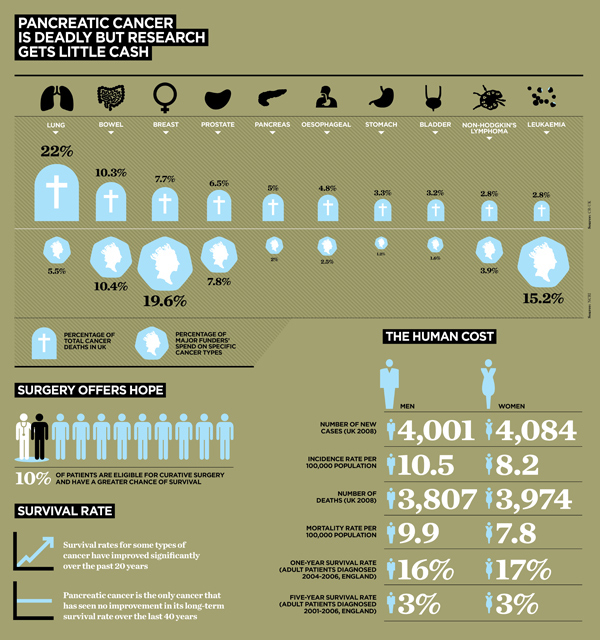
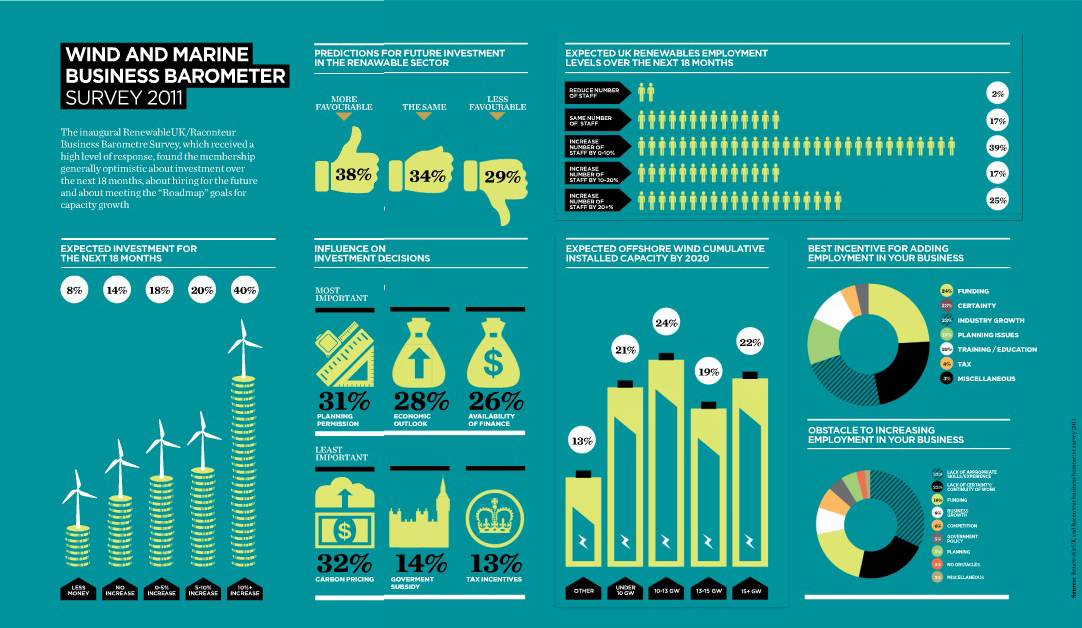
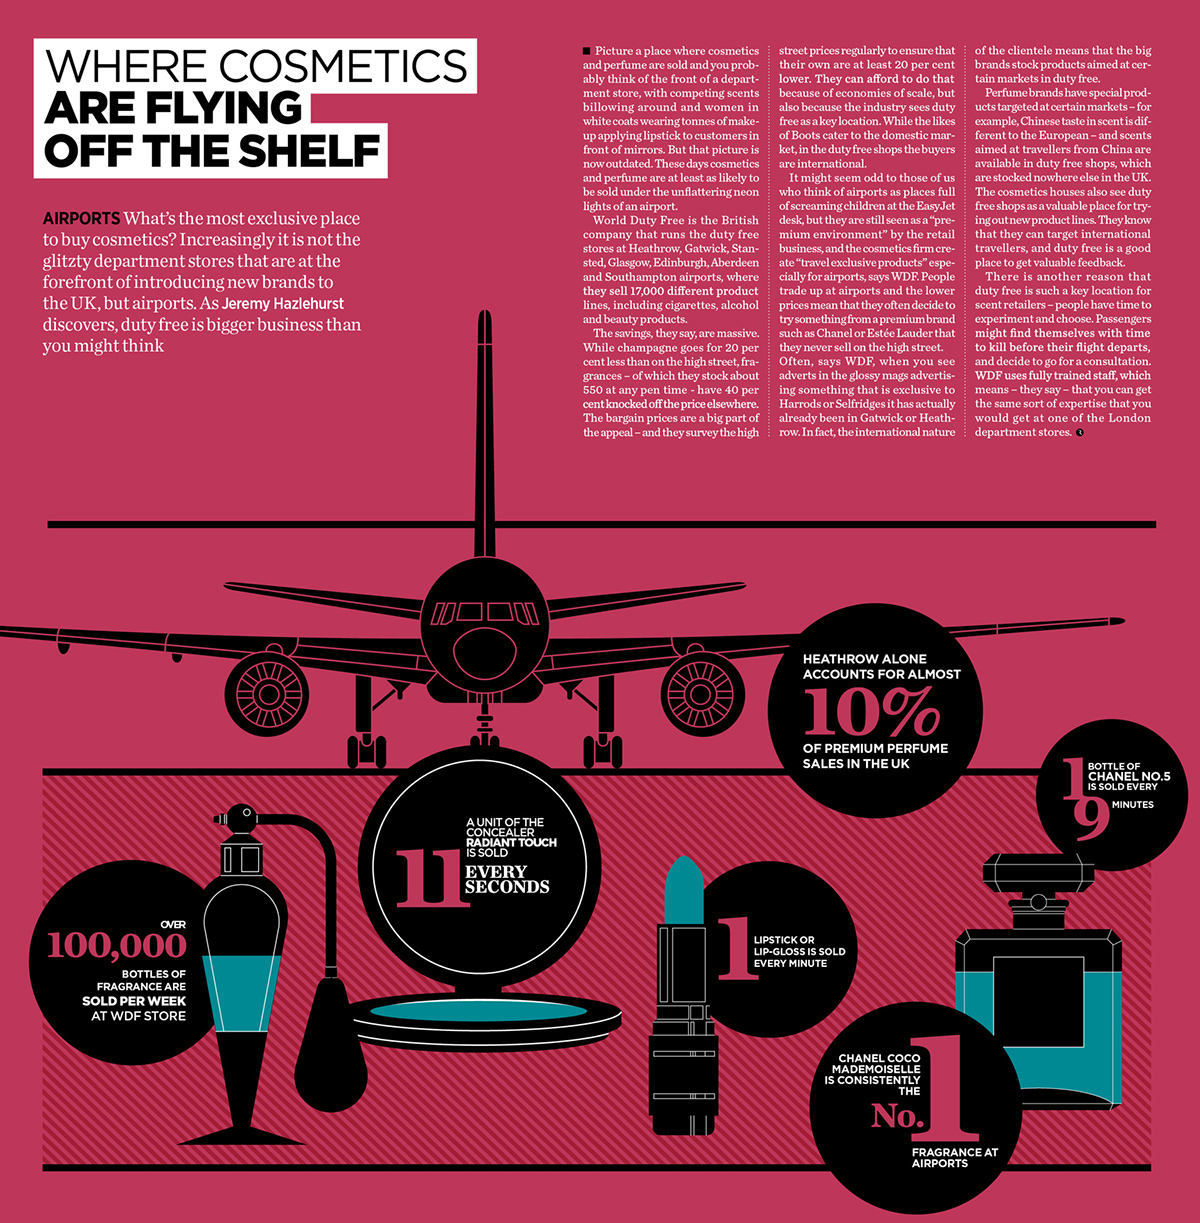
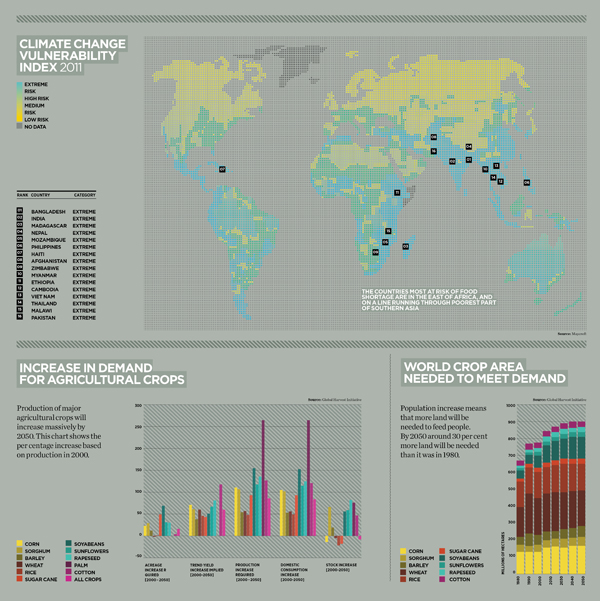
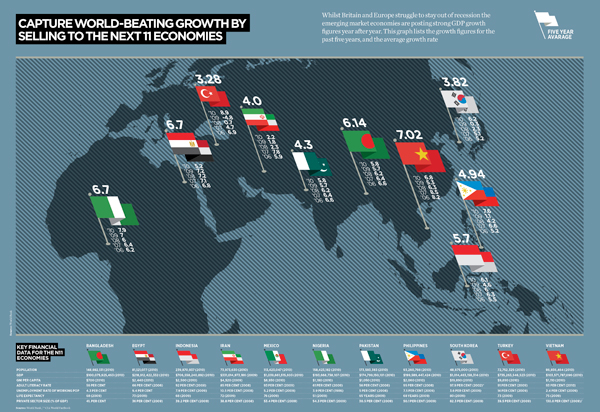
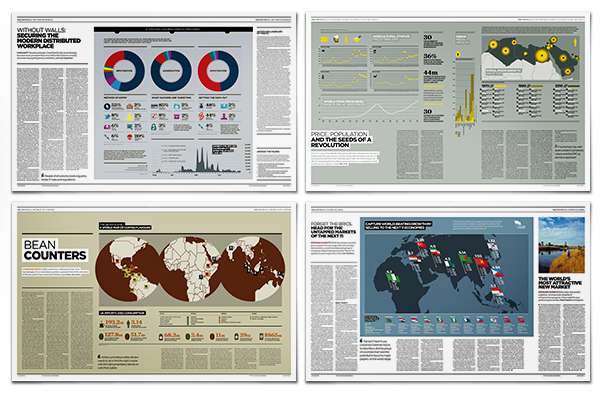
A series of infographics dashboards produced for Raconteur, a weekly 16-20 page special interest report supplement featured in The Times newspaper. Each infographic highlights interesting aspects of the data and combines this with engaging visuals from the topic. A minimalist approach makes the dashboard easy to read and understand.
Illustrated and designed by London design agency Surgery Redcow, these reports provides companies and organisations with an effective, informative and powerful communications platform that allows them to directly reach their core audience. Raconteur brings together content and sponsors in a credible package of quality journalism and cutting edge design.