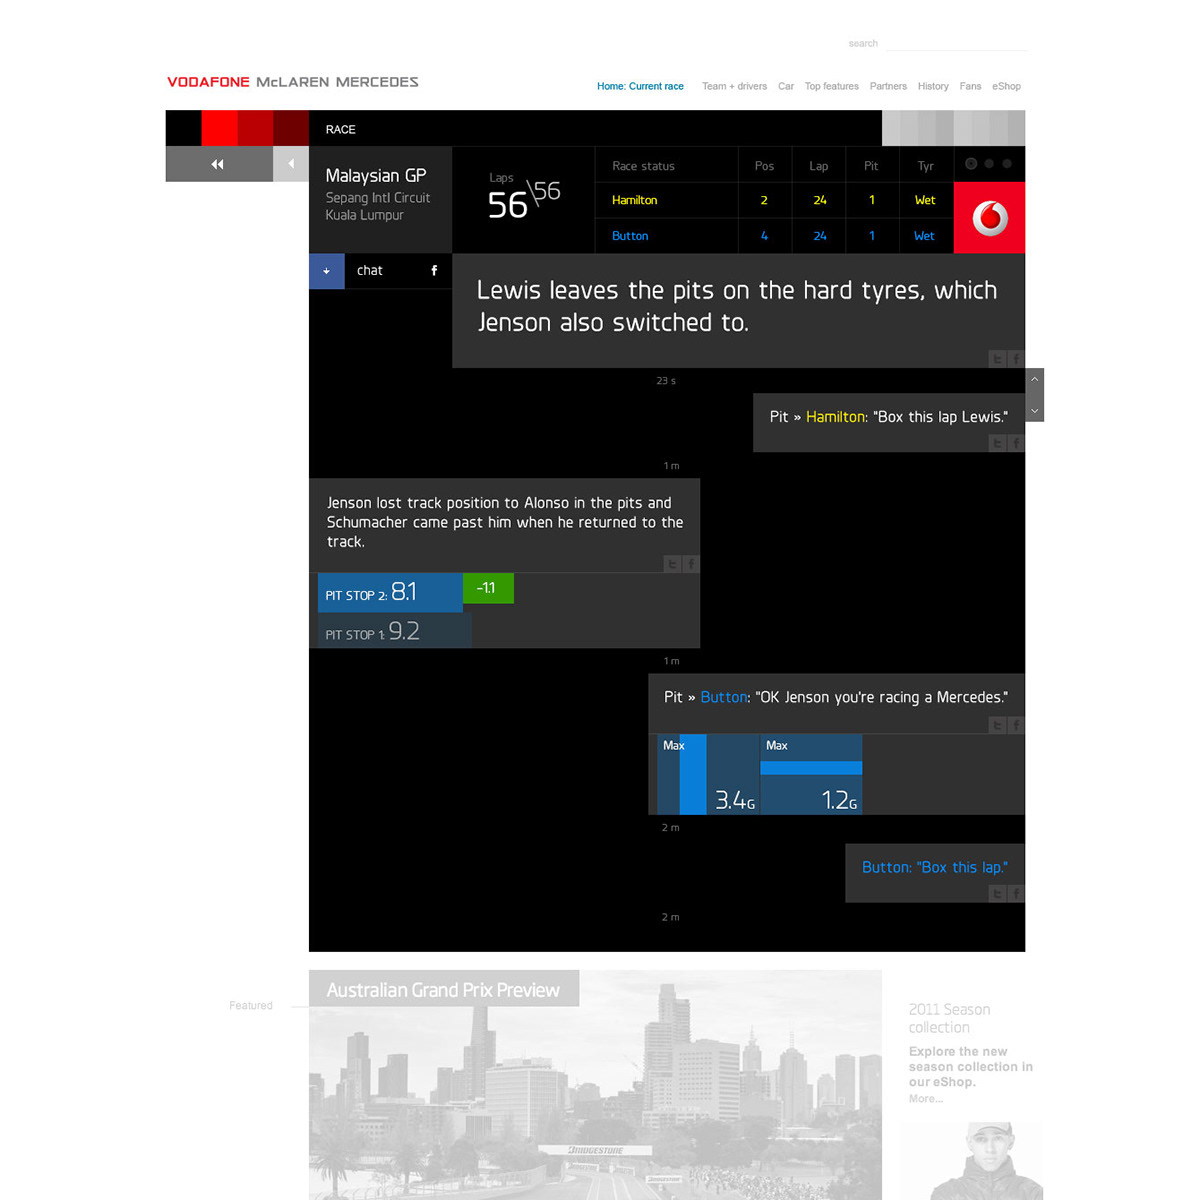
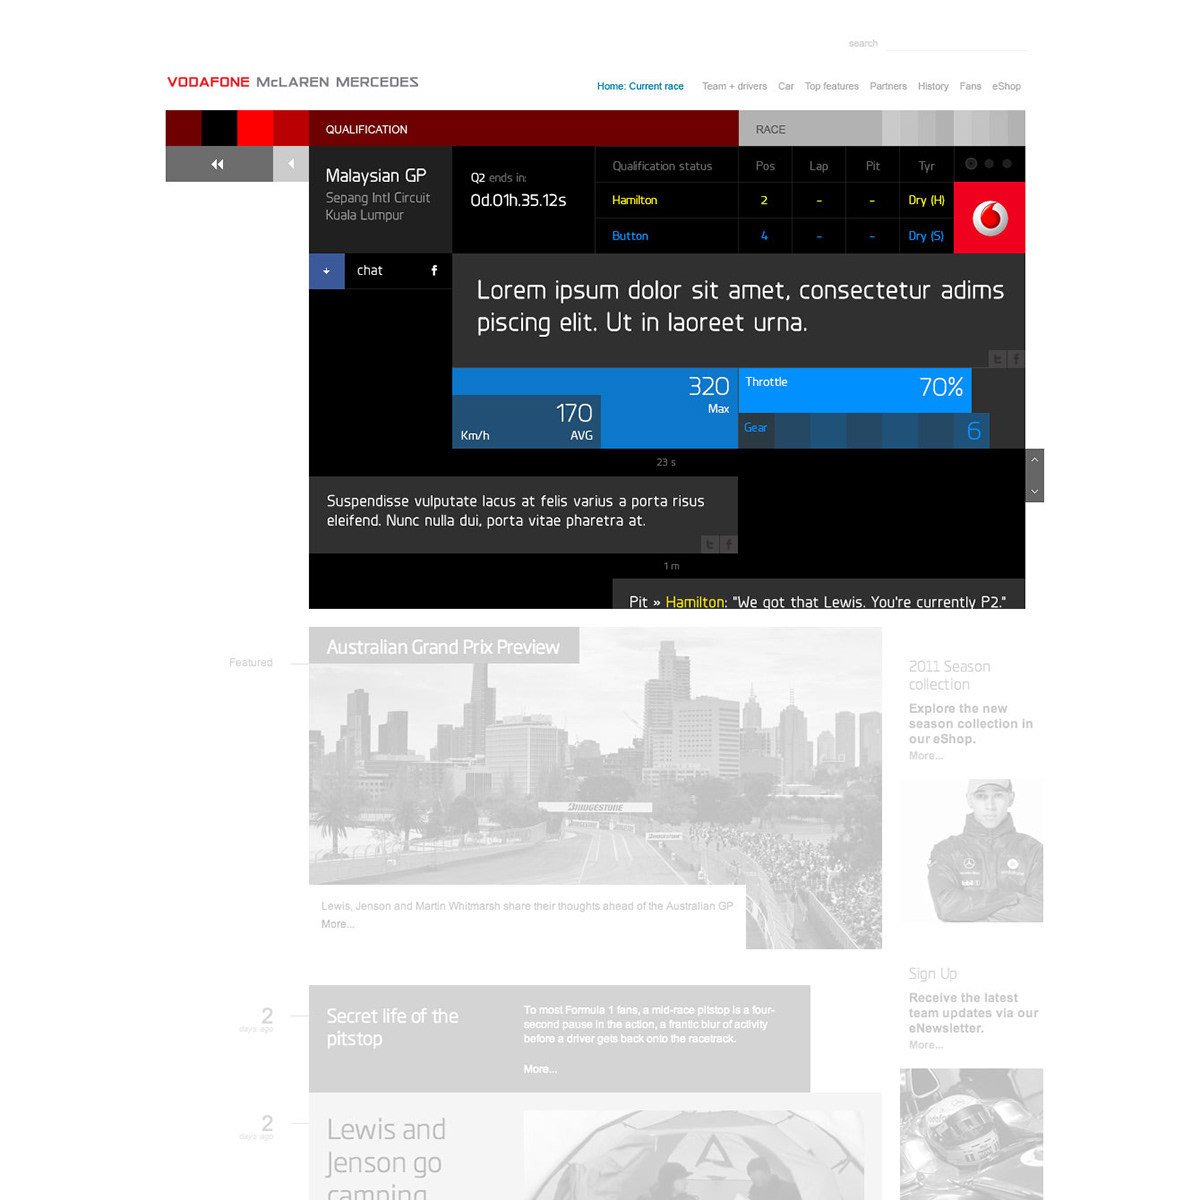
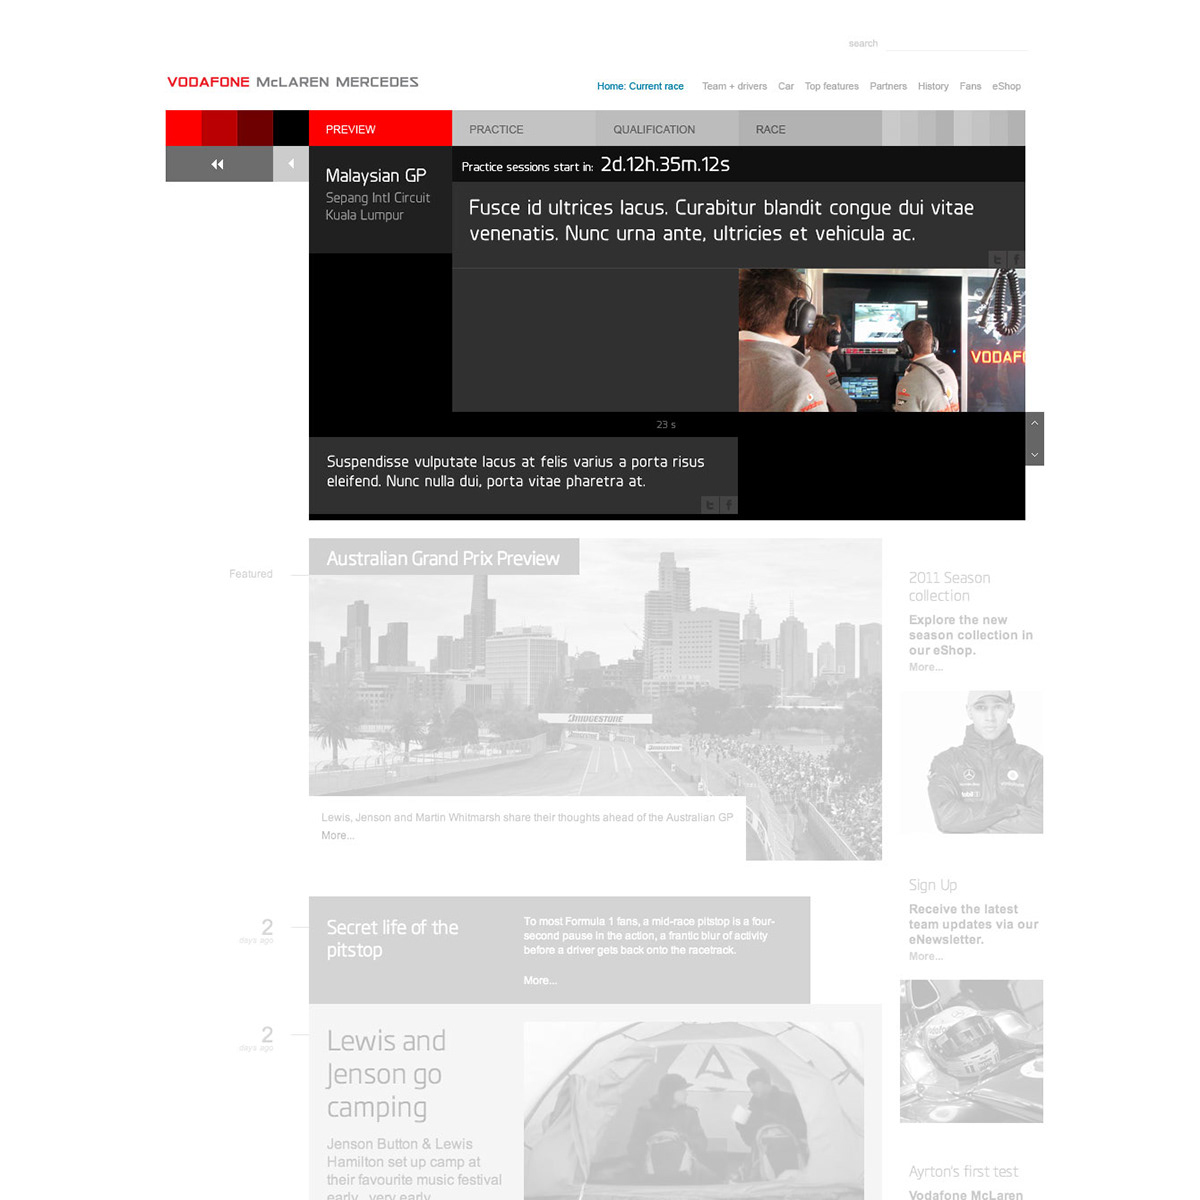
The Pit Wall, a development of our Race 1.1b accompanies the live TV broadcast delivering real-time telemetry data, driver radio transcripts and commentary from the pits.
After each race, the Pit Wall data is stored and collated to provide a comprehensive and up-to-date review of the 2011 season from McLaren's unique point of view.
Designed to be accessible from your laptop, tablet or smartphone.
Live site
After each race, the Pit Wall data is stored and collated to provide a comprehensive and up-to-date review of the 2011 season from McLaren's unique point of view.
Designed to be accessible from your laptop, tablet or smartphone.
Live site
Pit Wall
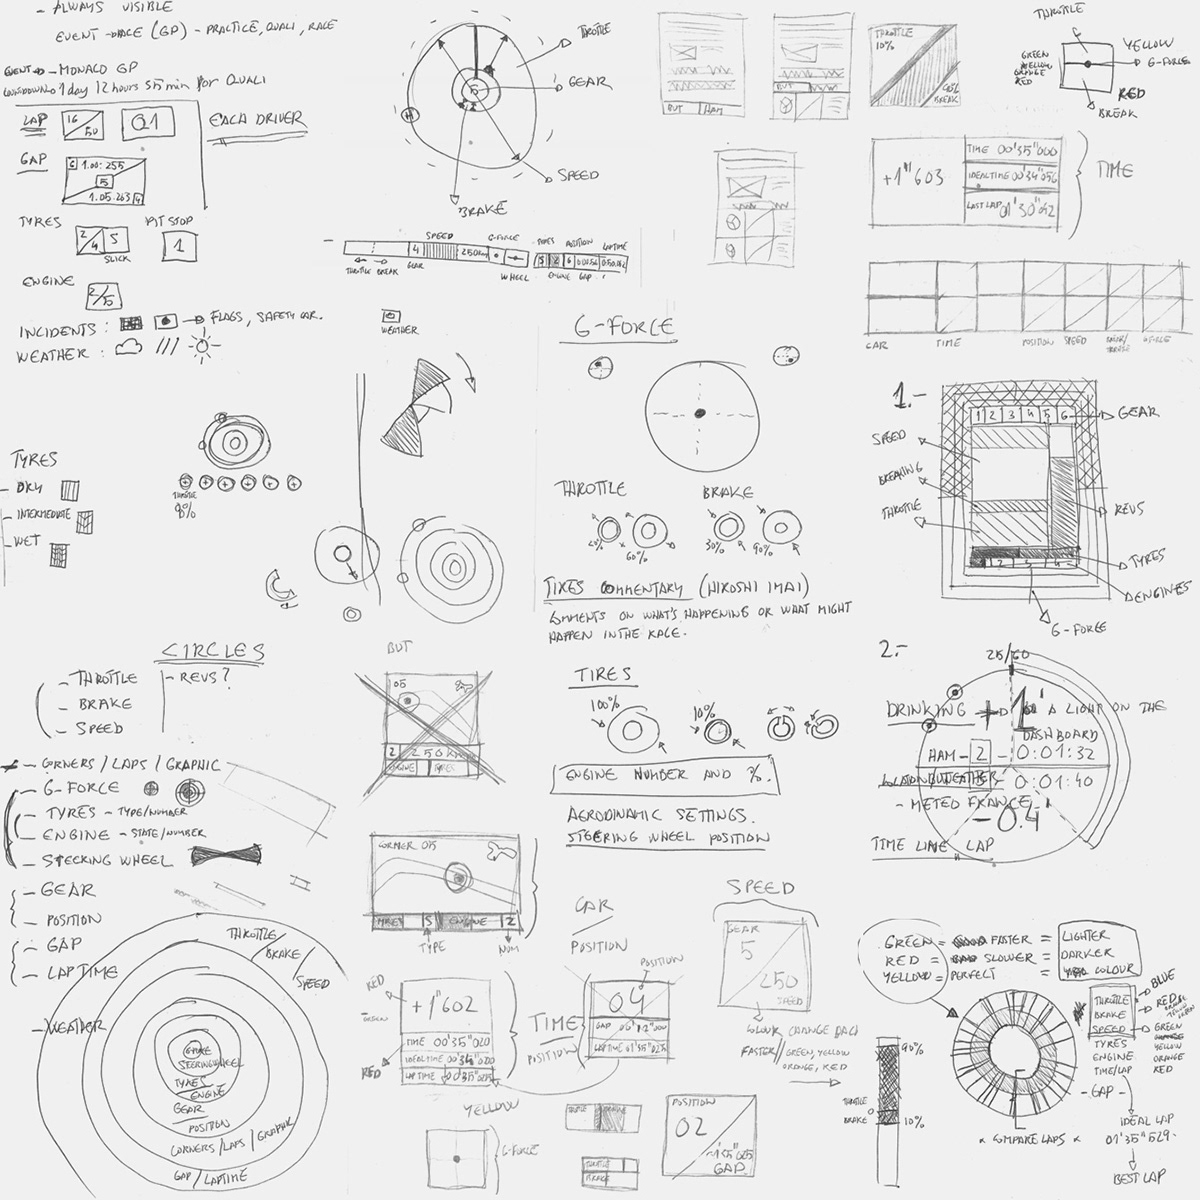
Design


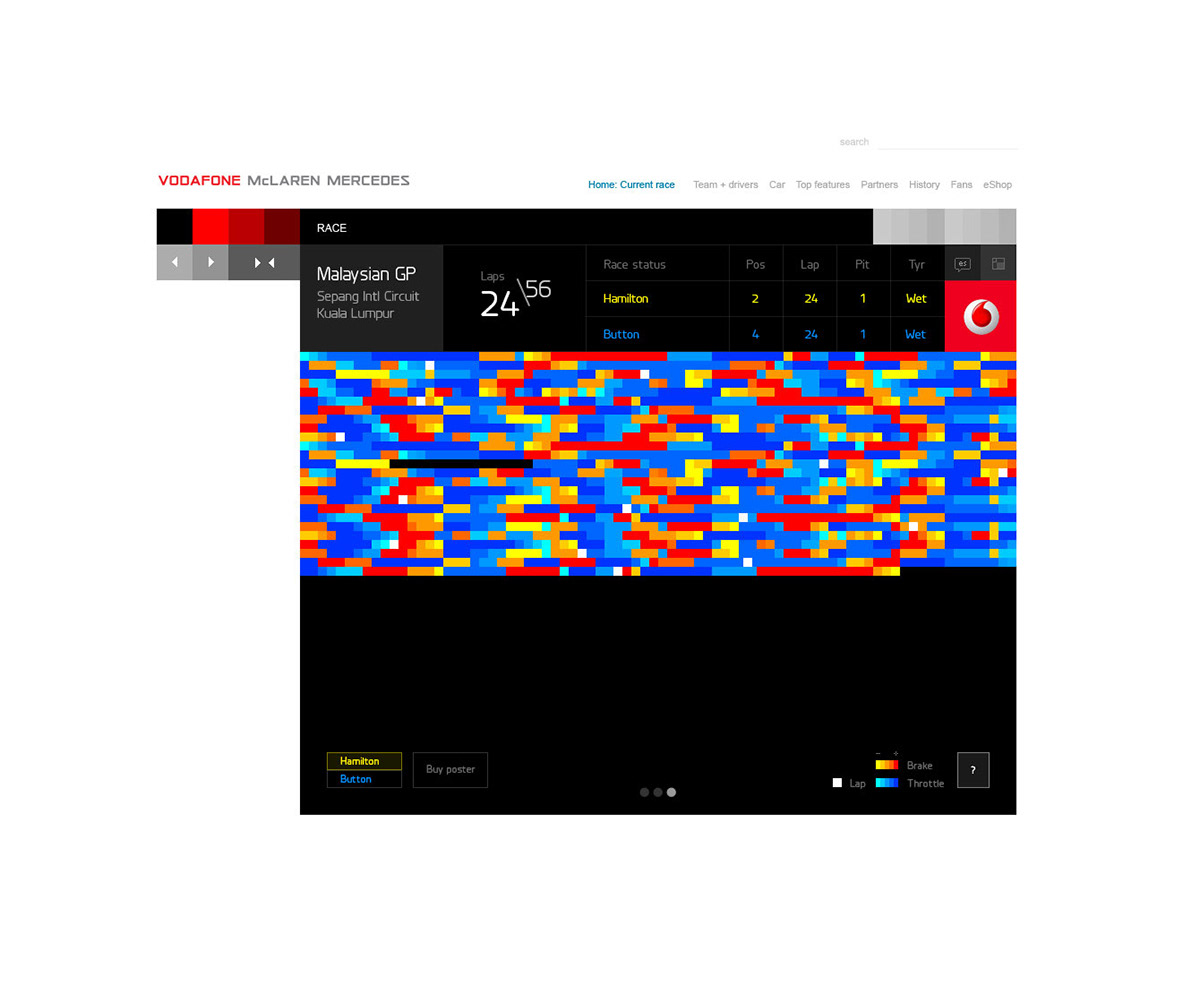
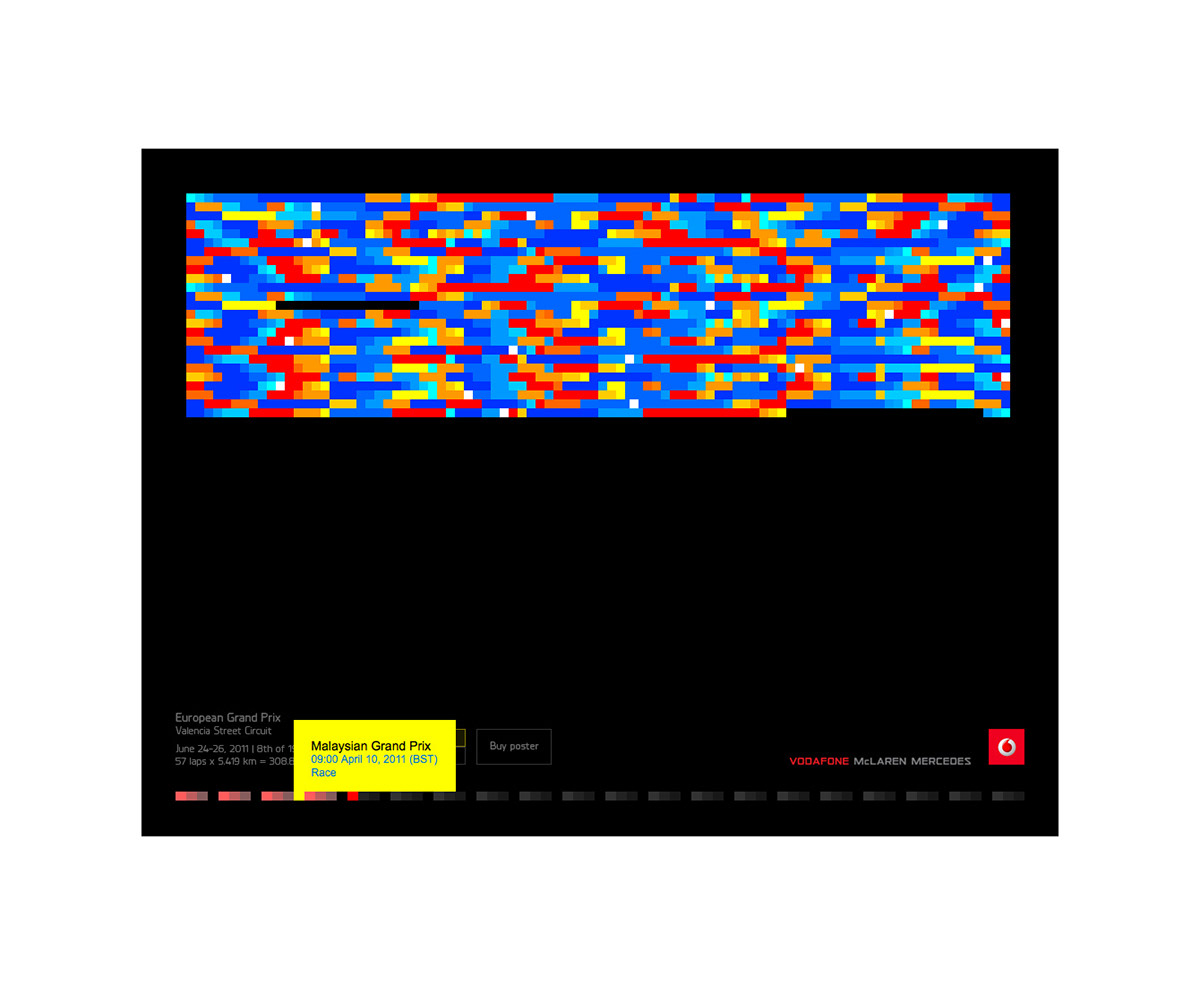
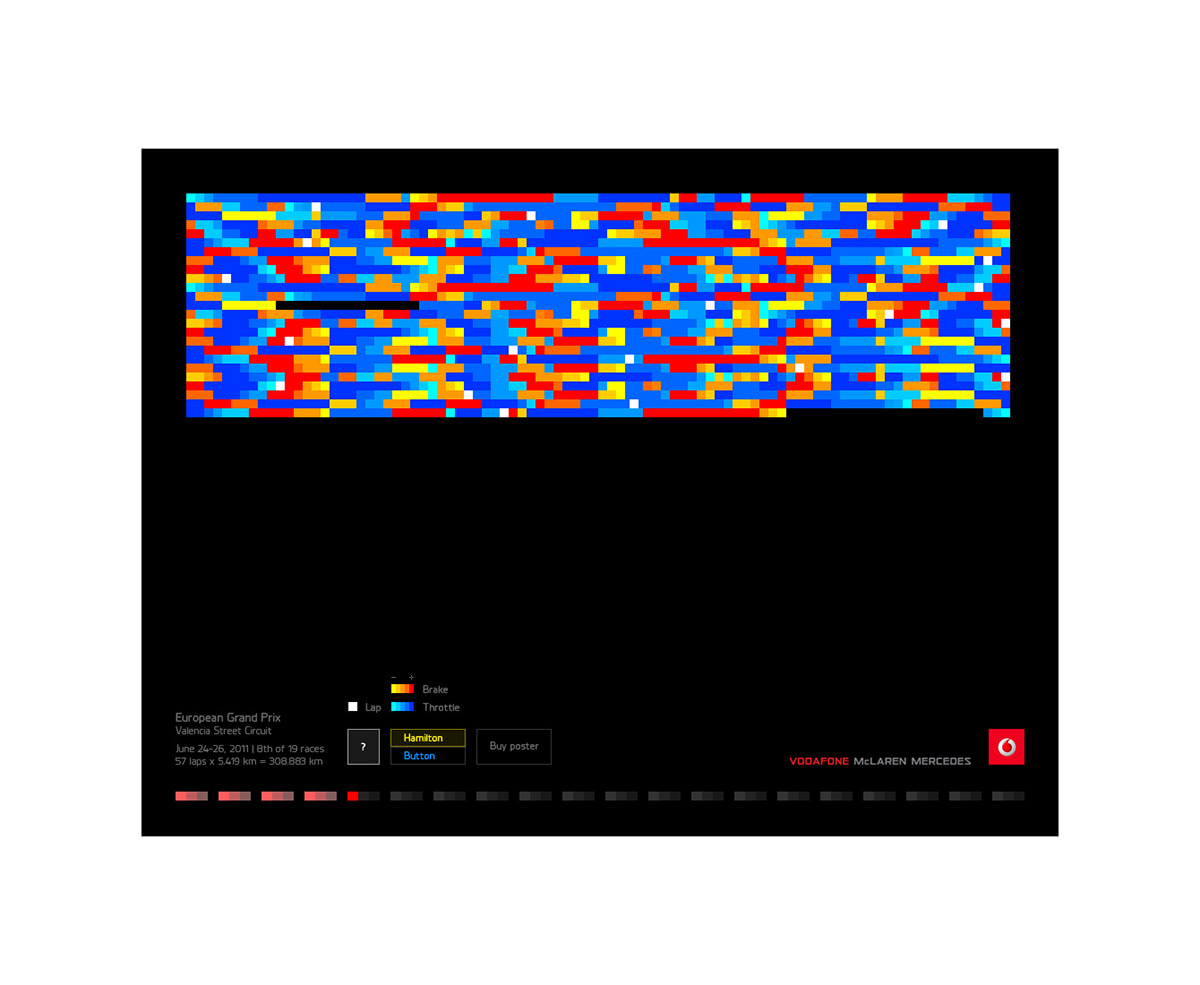
The race DNA (Data visualisation).
This view shows when a car is breaking and for how long. Each colour square represents a breaking or throttle percentage. Warm colours represent the brakes, from yellow (min) to red (max). Cold colours represent the throttle, from cyan (min) to dark blue (max). When there are no squares, the car is not moving. The white block shows the end of a lap.
Users can buy a poster with their favourite race in the online shop and see the race DNA of other races using the menu, which is visible when they move the mouse.
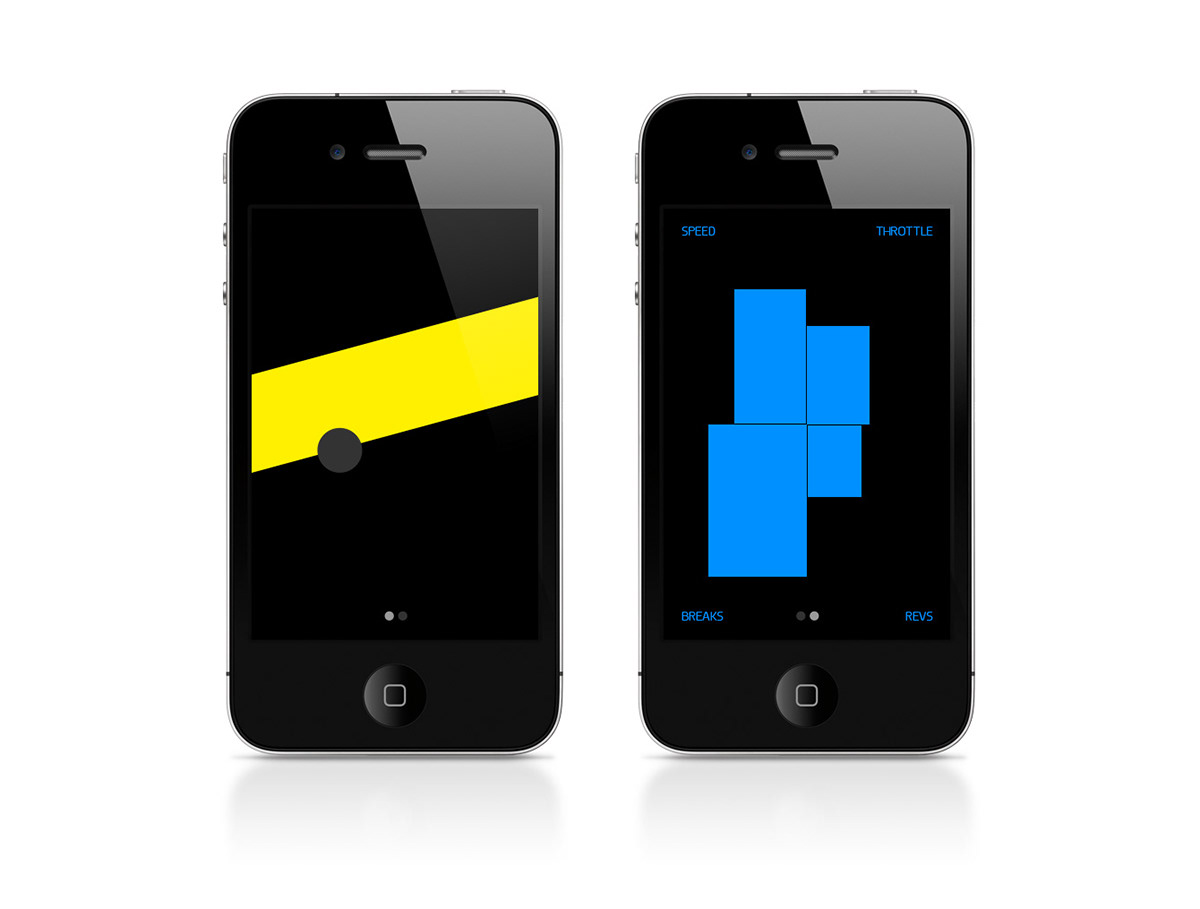
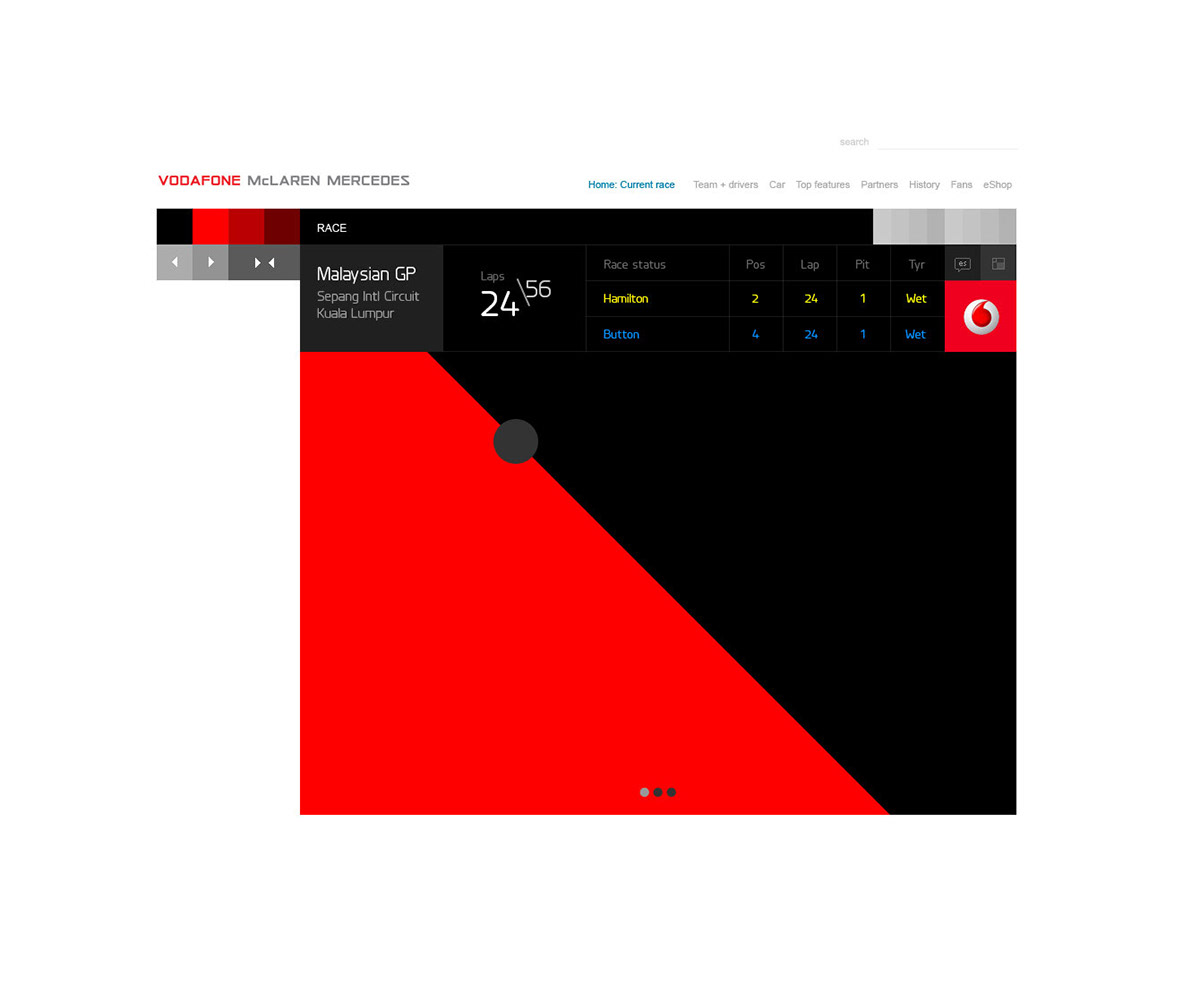
Never miss any corner, follow the drivers at all times during the race.
Users can see the throttle, brakes, lateral and inline g-force. This data give users all the information they need to imagine the car moving around the track. It works in a similar way to a compass, you can see the corners direction and diameter when looking at the g-force. See how hard they brake going in and how much they accelerate coming out. Brakes are red and throttle is the driver’s colour.
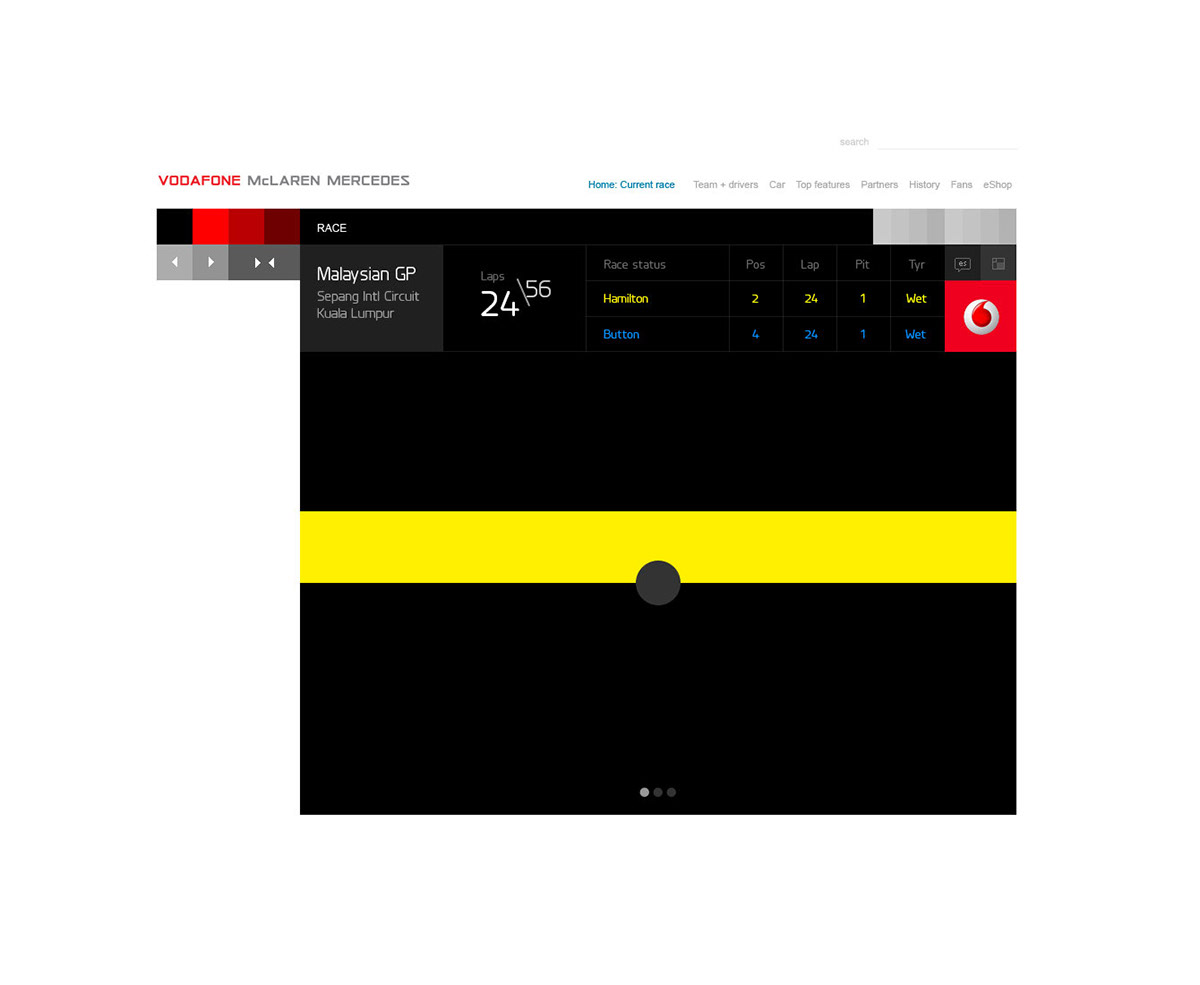
On the second view, users can compare the data and see how it relates to the other pieces of telemetry. Users can change between views by sliding left/right or change driver by tapping on the screen.
Users can see the throttle, brakes, lateral and inline g-force. This data give users all the information they need to imagine the car moving around the track. It works in a similar way to a compass, you can see the corners direction and diameter when looking at the g-force. See how hard they brake going in and how much they accelerate coming out. Brakes are red and throttle is the driver’s colour.
On the second view, users can compare the data and see how it relates to the other pieces of telemetry. Users can change between views by sliding left/right or change driver by tapping on the screen.

Screensaver
iPhone