A few words about this work
My original intention was to visualize the amazing disproportion between the main periods of time we humans usually take for reference, which is something that always fascinated me for the pattern it seems to create.
Indeed, there is a seemingly exponential acceleration in this global History of ours. Looking at these graphics, each next significant period always appear to happen late in its parent period (making often hard to even realize the existence of the n+2 period in the context of its grand parent).
However, since we're talking about open periods of time, it would be more accurate to say that each next significant period happens sooner in the context of the lifespan of its parent. In other words, if something happens, it seems all the more probable that something else will happen next sooner, and so on (even if talking about probability does not make much sense with such data).
In my opinion, this alone does not constitute a valid argument for a supposedly upcoming Singularity, as usually intended, because of the highly anthropocentric choice in the periods depicted here. That being said, I still find it interesting for what it is: a pattern in our subjective representation of time.
Worklow
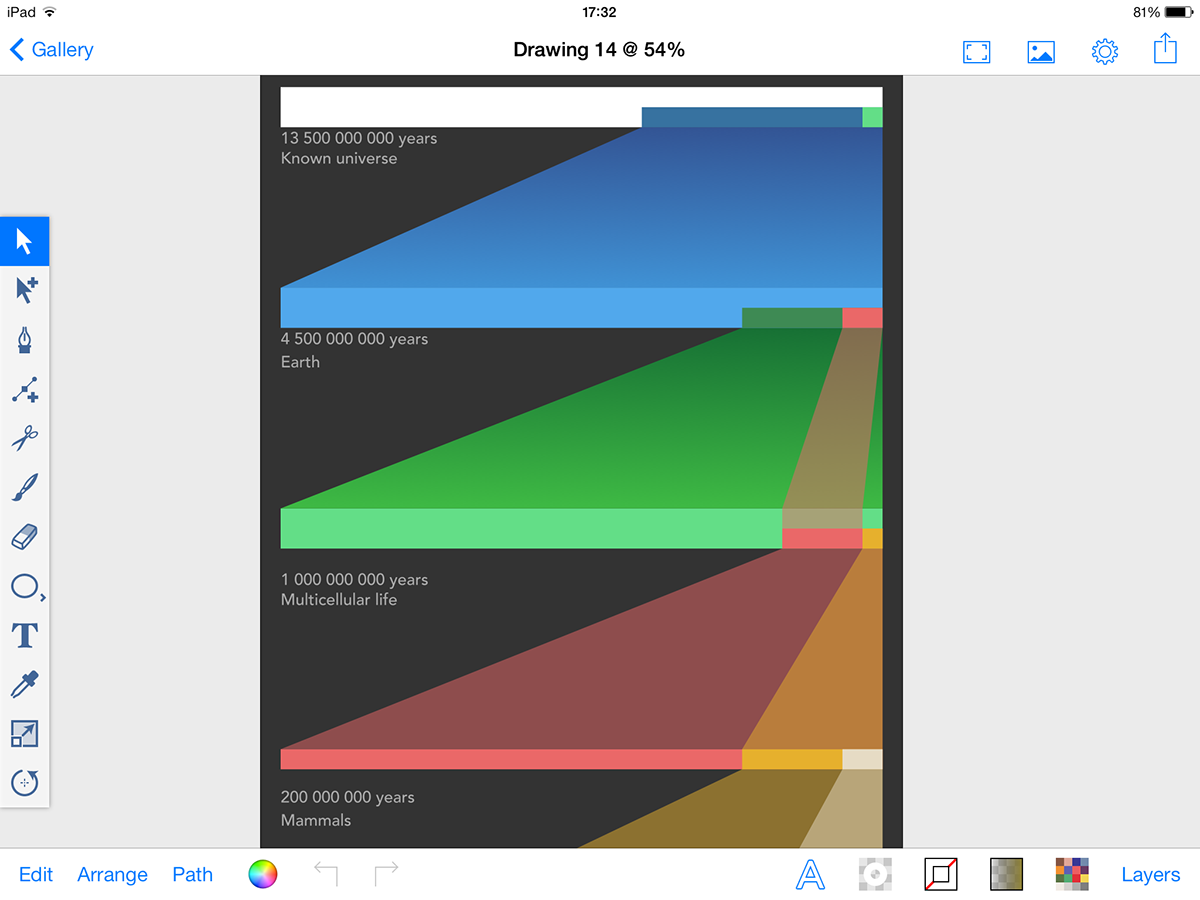
As usual, I started protoyping the visualization in Inkpad for iPad. At this stage data is fake, everything is done by hand just to find a decent way to represent relationship between timelines. I knew I wanted a way to zoom in time scales, and the only reasonable way I found was using the concept of stairs.
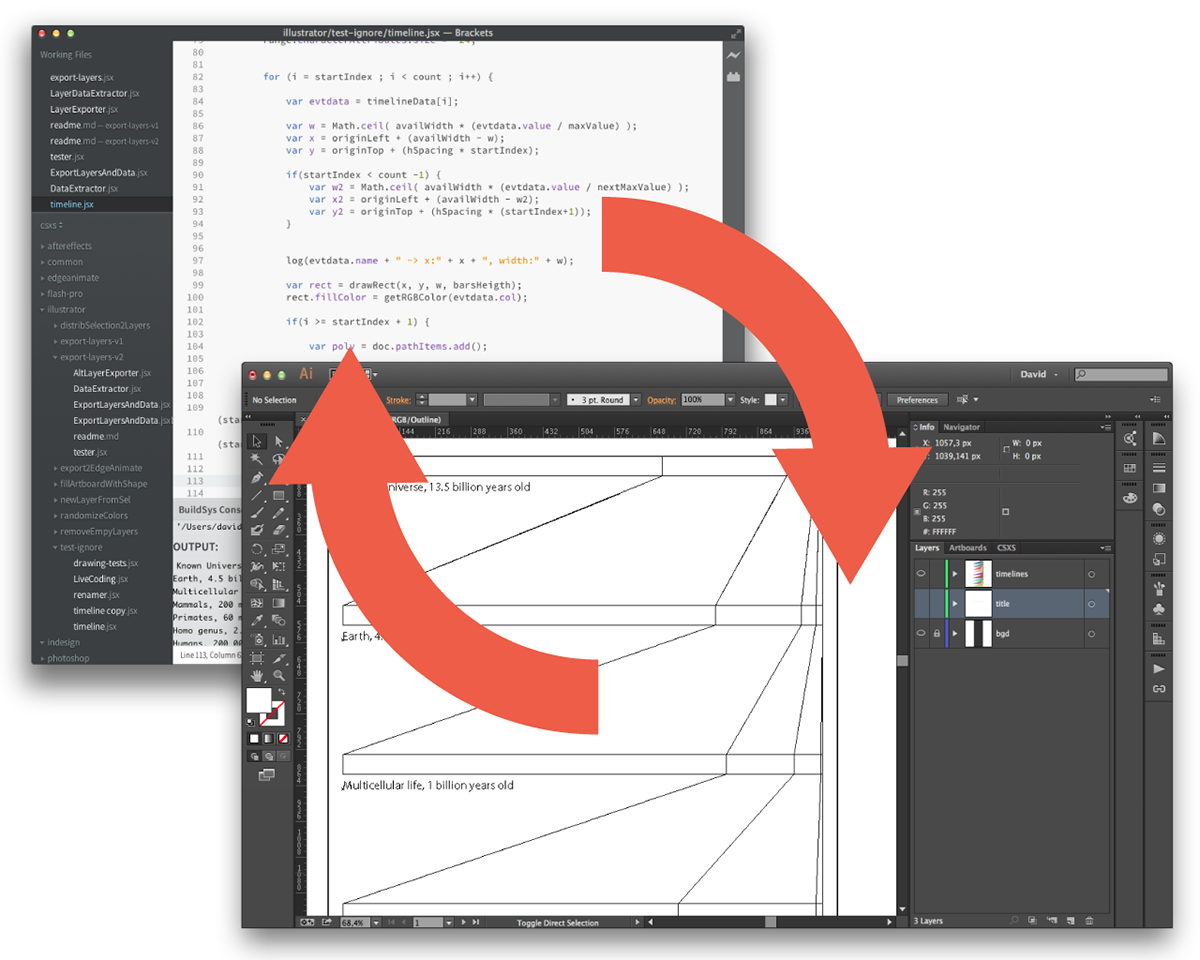
From that point, I opened it in illustrator to clean it and start the actual workflow.
I removed all the timeline drawing from illustrator and started recreating them dynamically via javascript, this time of course using accurate data. This is a very recursive workflow, where I go back and forth between the code editor and the graphics editor.
This workflow is incredibly powerful because it lets you draw non destructively using real data, like with a chart, but lets you full control over the resulting art.