
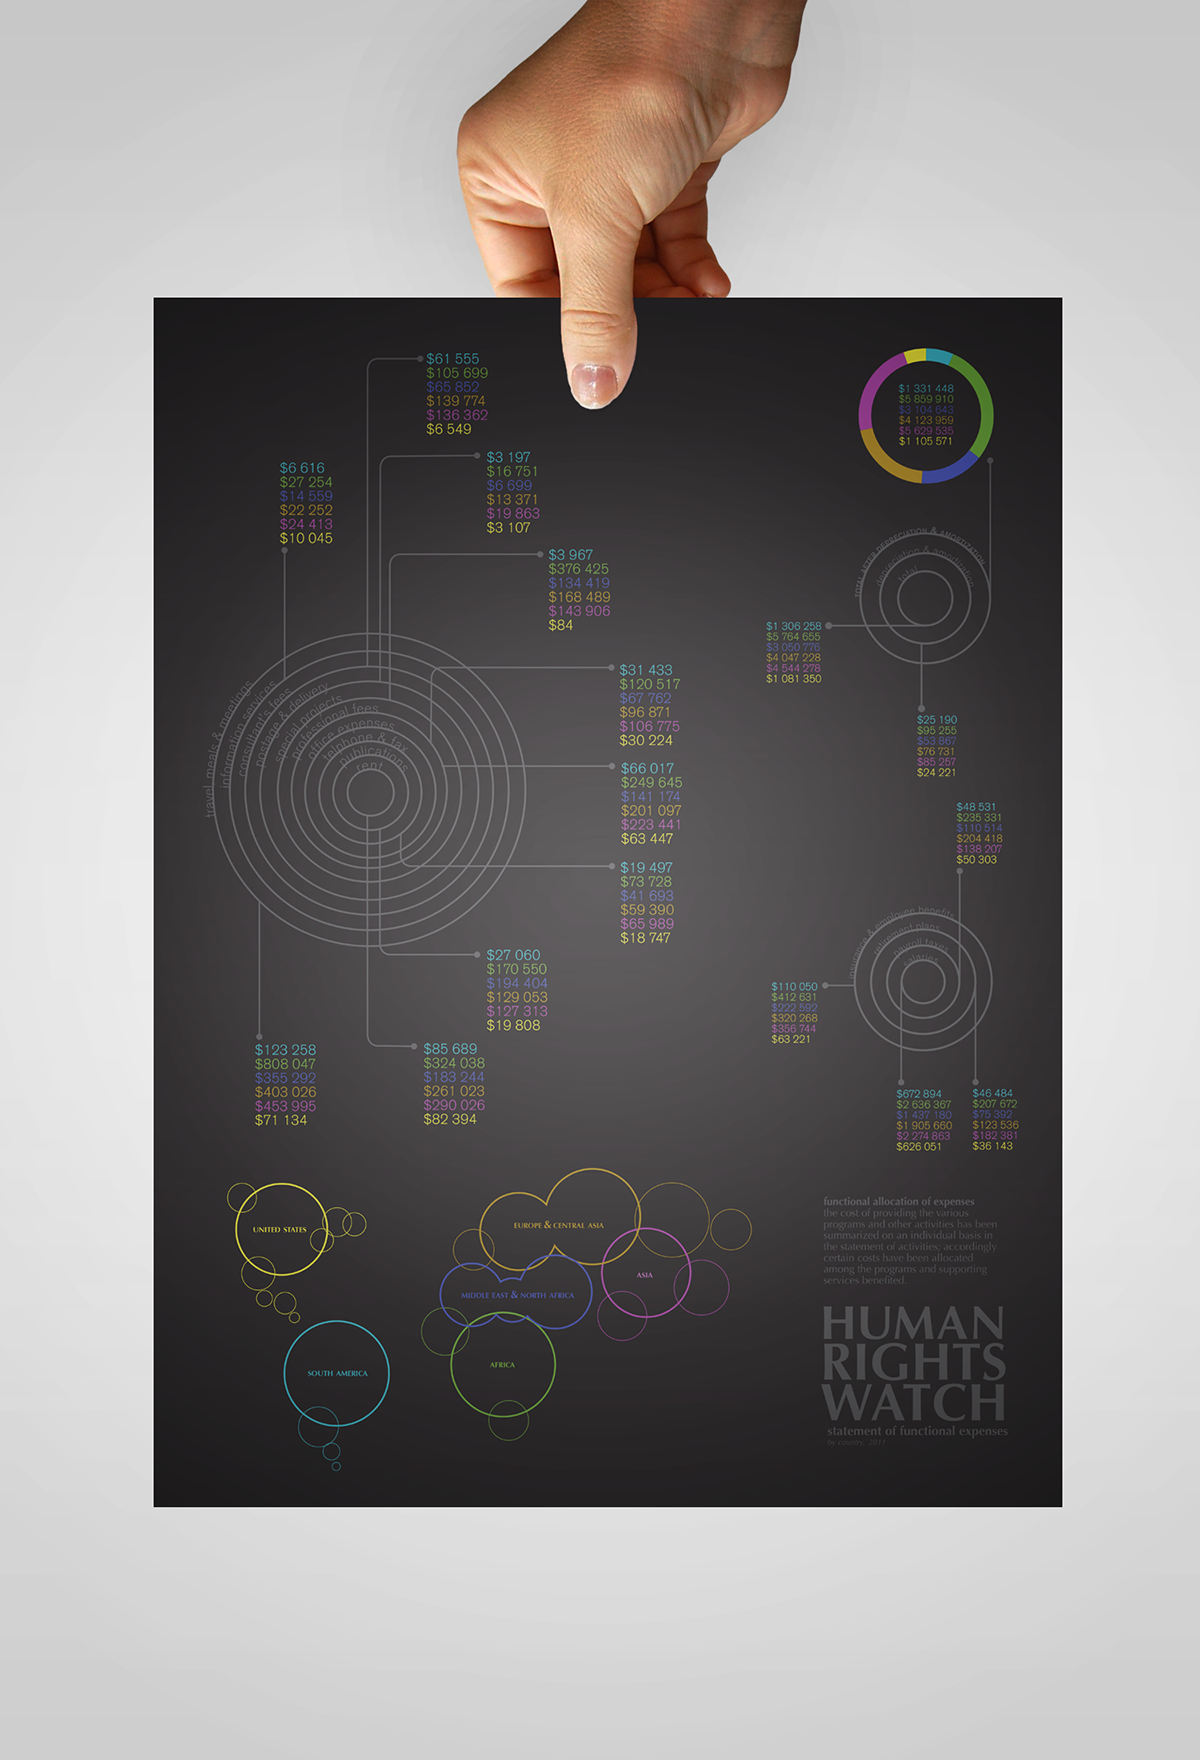
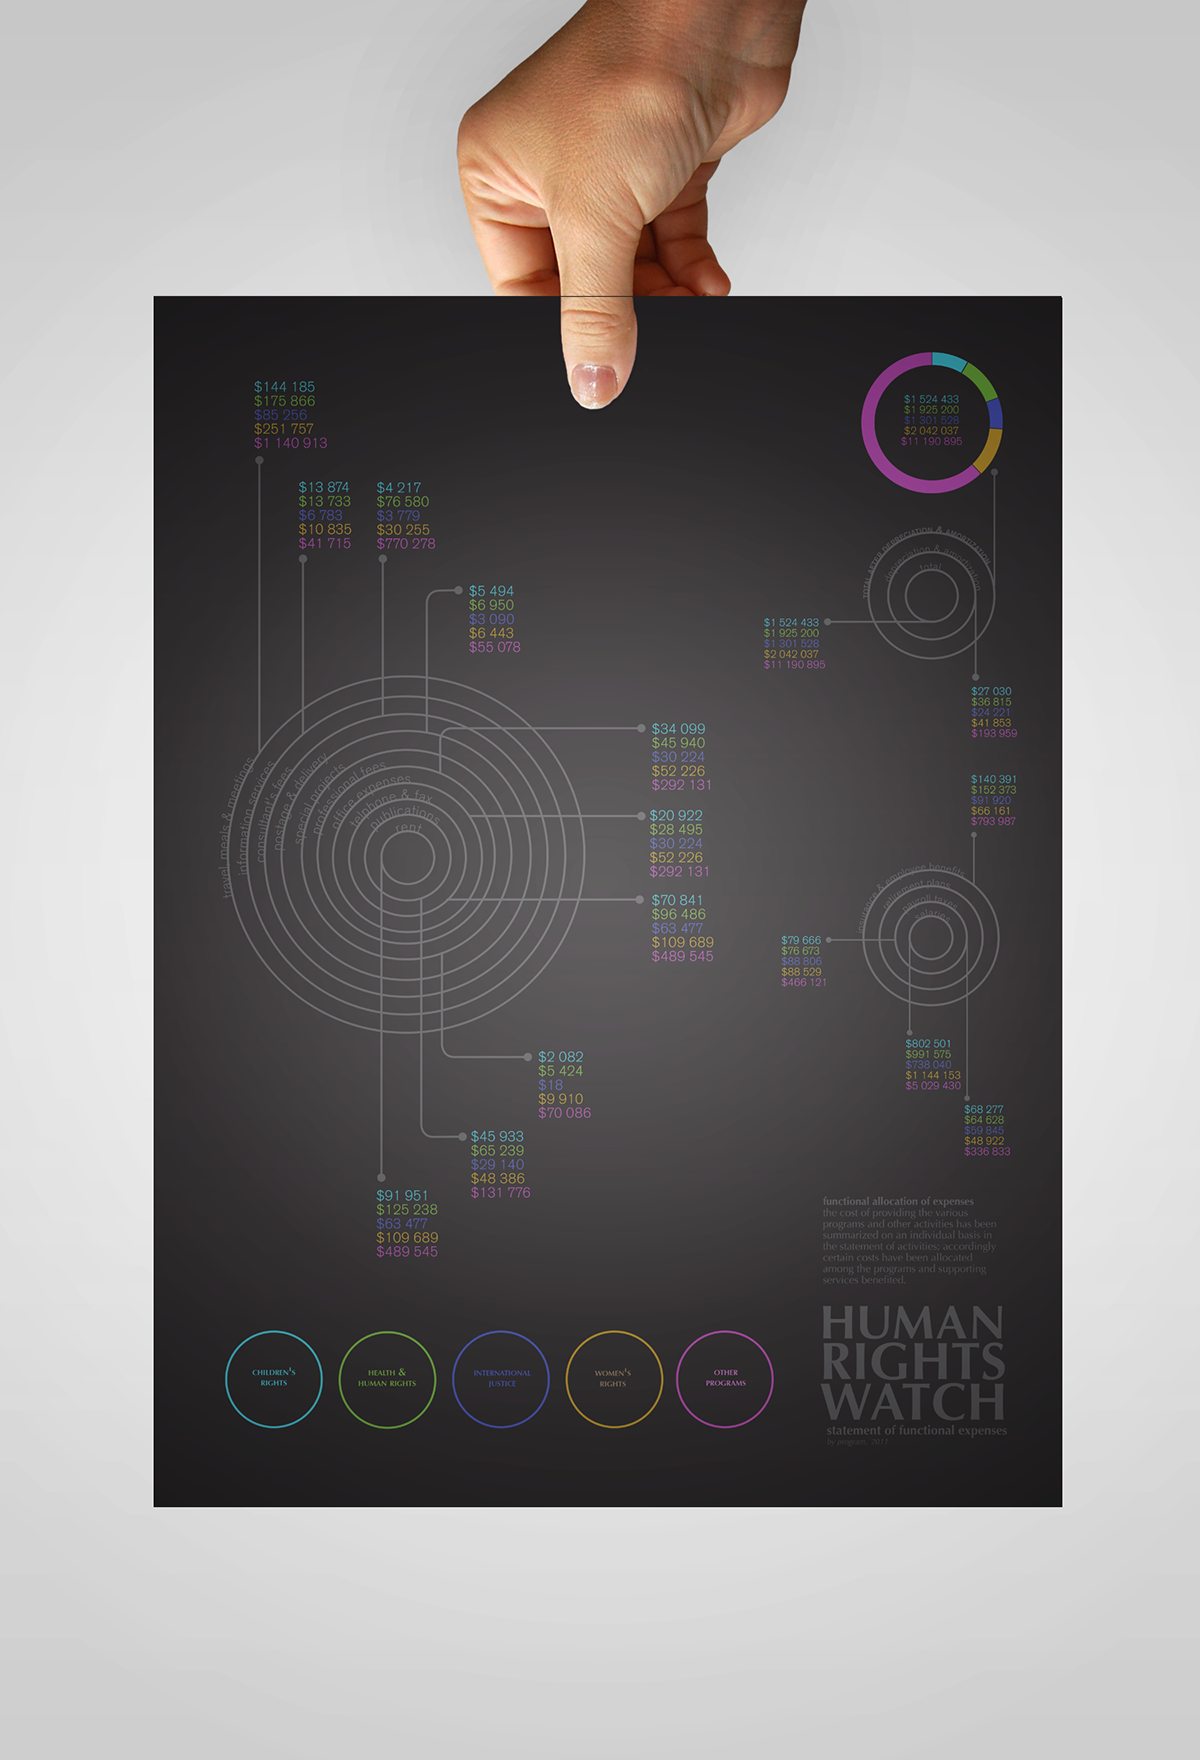
This series of infographics was created using the Human Rights Watch 2011 Annual General Report financial data. With the understanding that finances are often represented in simple tables and graphs and as such, are often overlooked, this project was an exercise in disseminating raw data and representing it in a manner that captures the attention of the target audience. This type of information is essential for a non–profit organization to widely distribute and share so as to demonstrate their committment to transparency and accountability.

*** Disclaimer: This is a conceptual project and is not endorsed
nor was commissioned by Human Rights Watch. ***
nor was commissioned by Human Rights Watch. ***
THANKS FOR STOPPING BY.