Log In
Discover
Assets
Jobs
Behance
Pro
Hire Freelancers
Download on the App Store
Get it on Google Play
English
Čeština
Dansk
Deutsch
Español
Français
Italiano
Nederlands
Norsk
Polski
Português
Pусский
Suomi
Svenska
Türkçe
日本語
한국어
中文(简体)
中文(繁體)
About
Blog
TOU
Privacy
Community
Help
Do not sell or share my personal information
Sign Up
Skip to Main Content
Skip to Footer
Behance
Behance
Navigate to behance.net
Explore
Assets
Jobs
Behance
Pro
Hire Freelancers
search
magnifying glass
Sort & filter all:
Projects
Images
People
Assets
People to Hire
Cancel
search
magnifying glass
View your notifications within Behance.
View your notifications within Behance.
Log In
Sign Up
search
magnifying glass
Adobe, Inc.
Adobe, Inc.
Navigate to adobe.com
Infography/dataviz
A moodboard by
Antoine Bardet
94 Items •
22 Followers
Follow
Moodboard
Following
Moodboard
Unfollow
Moodboard
Atlas of contemporary technology - Diagnosing chapter
Multiple Owners
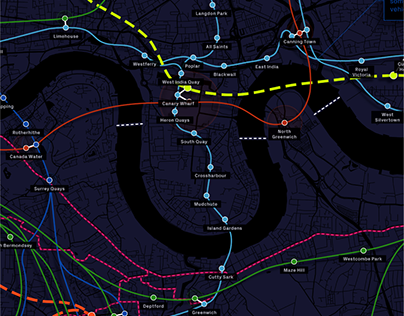
Tunnel Vision
by
Josh Gowen
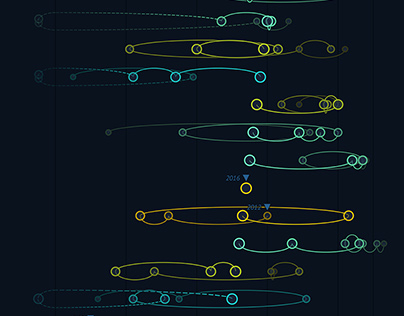
The Greatest Switch datavisualization
by
Sonja Kuijpers
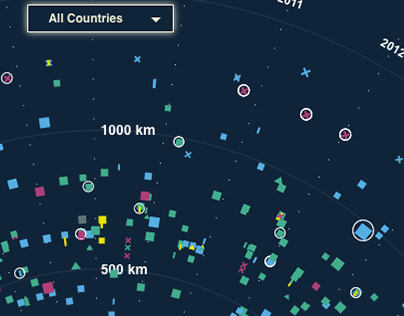
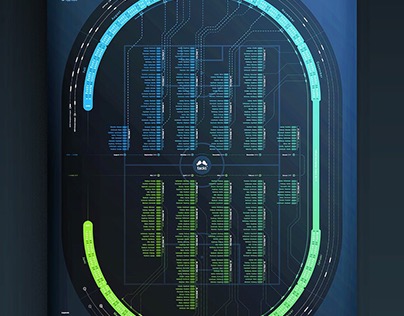
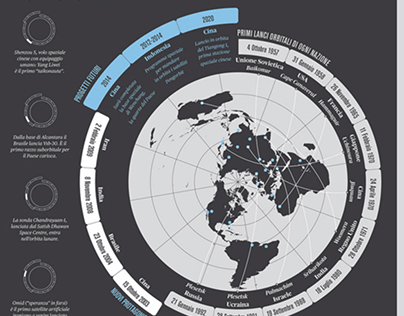
Visualeyed / Satellites orbiting planet Earth
Multiple Owners
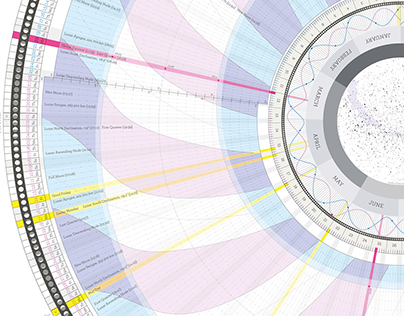
anaptár 2017
by
anna farkas
Infografía - Reducción de áreas verdes
by
Florencia Brunetti
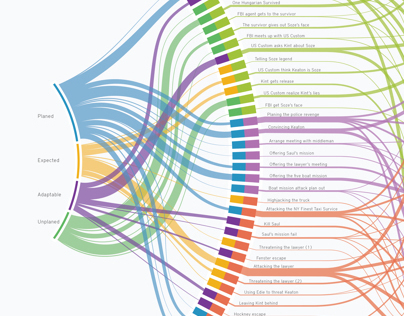
It's all part of the plan
by
Nattakarn Tapasanan
tackl Bundesliga Calendar
by
Bureau Oberhaeuser
Map of fictional places
by
Federica Fragapane
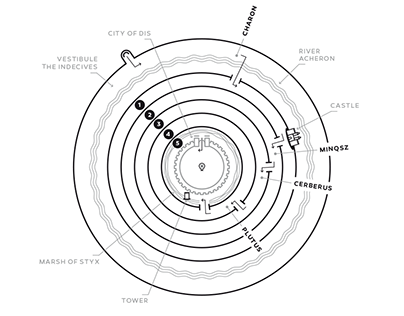
Dante - Divine Comedy / Book Illustration (Infographic)
by
Janos Baksa
Infoporn, WIRED Magazine
by
Raul Aguila
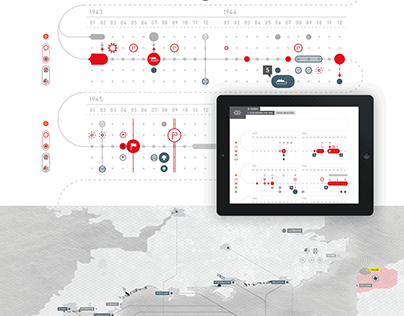
World War II (Infographic)
by
Janos Baksa
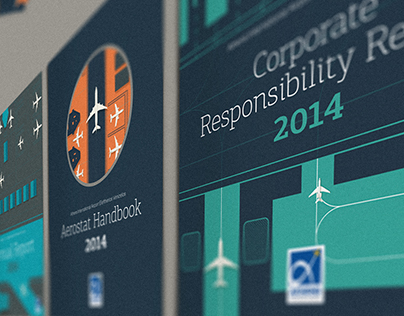
Athens International Airport Annual Editions 2014
by
Sinc. Design
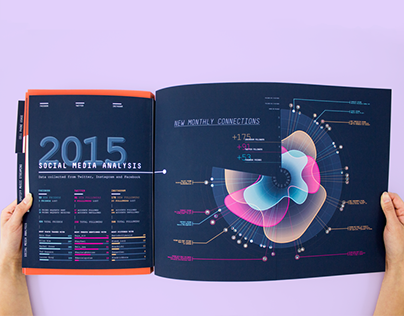
Personal Annual Report 2015
by
Jermaine Boca
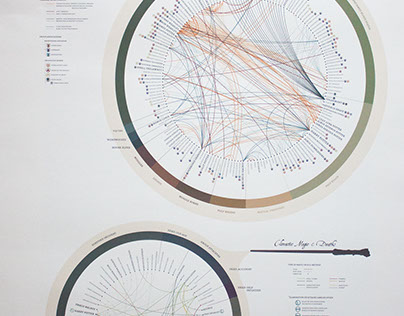
Harry Potter relations network
by
Nicole Mannell
Information Design
by
Prachi Chaudhari
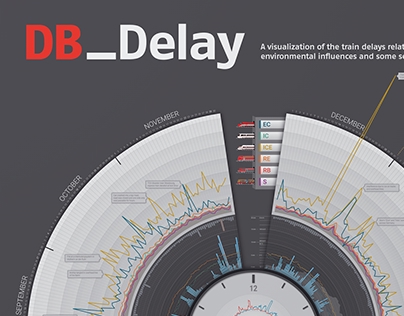
DB_Delay - Information Graphic
by
Christian Matz
Interchange Choreography
by
Nicholas Rougeux
The Rise and Fall
by
Erin L. M. McGuire
Infographic Calendar 2012
by
Bureau Oberhaeuser
Timeline + Concept Map
by
Josh Parenti
IL - Istruzioni per l'uso
by
Francesco Muzzi
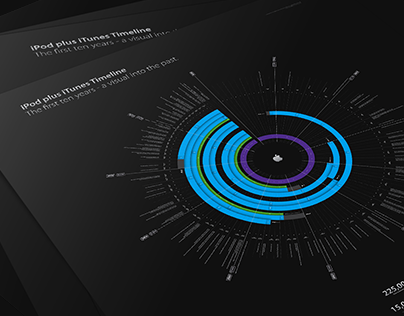
iPod plus iTunes Timeline
by
Filip Chudzinski
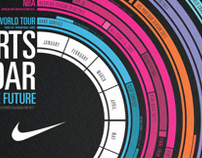
Write the Future - Calendar
by
Estudio Agraph | Drawing Architecture
3D printed infographics
by
Jim Van Raemdonck
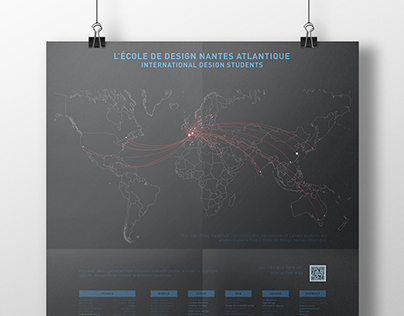
French design schools, data visualization project
Multiple Owners
Klarna Data Wall – real-time data visualization
by
onformative .com
Elephant Magazine #25 #26 — Infographics
by
LA TIGRE
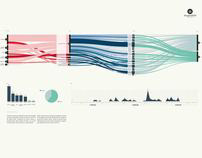
Datavisual | The Global Shift of Humanity
by
Jesse van Veghel
How The Swiss Die
by
LargeNetwork Infographics
I am CULTURA / La Lettura
Multiple Owners
A VISUAL YEAR_2015 Calendar
by
Francesca Casadio
Il Corriere della Sera, LaLettura |Freedom in countries
by
Sara Piccolomini
Sex (Un)Education
Multiple Owners
NEWS STREAM
by
Manuel Reitz
Call Me
by
Thomas Ricciardiello
Between the Words
by
Nicholas Rougeux
Bureau Oberhaeuser Calendar 2016
by
Bureau Oberhaeuser
Cross-linguistic controversy shapes - MSc Thesis
by
Marta Croce
THE DARK SIDE OF THE FOOD - Dark Version
by
Andrea Spinazzola